Cars
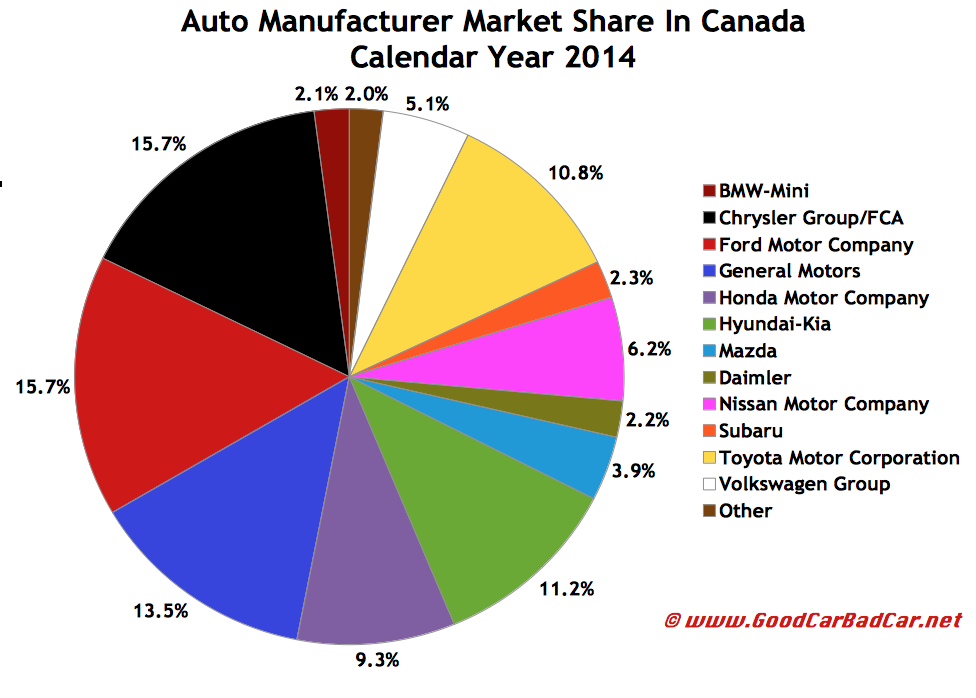
 Canadians registered a record number of new vehicles in 2014 after setting the previous record in 2013. 1.85 million new cars, trucks, SUVs, and vans were sold over the last twelve months, a huge 6% and 106,000-unit increase from 2013 levels.
• All Vehicles Ranked By December & 2014 Year End Canadian Sales
Ford is Canada's top-selling auto brand and top-selling manufacturer, with help from Lincoln. No volume brand posted a more significant year-over-year percentage increase in 2014 than Jeep, which jumped 58% to 70,503 units, claiming 3.8% of the overall market. The sharpest declines belonged to Scion, Mini, Volvo, Kia, and two of Jeep's sibling brands, Chrysler and Dodge.
Canada's top-selling premium brand was Mercedes-Benz. Canadians made the Honda Civic their favourite car for the 17th consecutive year. The Ford F-Series continues to be the top-selling vehicle; the Ford Escape continues to be Canada's best-selling SUV/crossover. The Dodge Grand Caravan earns more than half the minivan market's volume.
If you prefer not to see automakers listed alphabetically, click column headers to sort automakers by 2014 ranking, 2014 sales, year-over-year change, or any other order. Year end best seller lists for cars, trucks, and SUVs will be added later this month. In the coming days, GCBC will also publish a complete list of year end/December sales for every single vehicle line, a list which includes brand results. To find out what you can expect, you can see November's version of that post here. You can always find historical monthly and yearly sales figures for any brand by clicking the brand name in the table below or by selecting a make (or model) at GCBC's Sales Stats page. The + icon has been removed from year-over-year improvements. Look instead for red font to designate year-over-year declines.
Click column headers to sort by specific categories. Using the mobile version of GoodCarBadCar? Switch to the web version at the bottom of the page, at which point columns should be sortable.
2013 Year End • 2012 Year End • 2011 Year End • Updated at 5:23 PM AT on 01.14.2015
Source: Automakers & ANDC
Red font indicates declining year-over-year volume
* Does not include Lamborghini
^ Excluding Sprinter: up 8.2% to 33,928.
RECOMMENDED READING
Canada Auto Sales Brand Rankings - 2013 Year End
Canada Auto Sales Brand Rankings - 2012 Year End
Canada Auto Sales Brand Rankings - 2011 Year End
Canada Auto Sales Brand Rankings - December 2014 & Year End
- Canada Auto Sales Brand Rankings - December 2014 And 2014 Year End
Canadian auto sales rose to record levels in calendar year 2014, a strong follow-up to a record-setting year in 2013. • All Vehicles Ranked By December & 2014 Year End Canadian Sales Click Chart To ExpandIn December, specifically, gains...
- Usa Auto Sales Brand Rankings - 2014 Year End
As we update GCBC's December 2014 brand-by-brand results page with U.S. auto sales figures, this page will also be updated with a concentration on the year end numbers alone. • U.S. Vehicle Sales Rankings By Model - 2014 Year End...
- Canada Auto Sales Brand Rankings - November 2014 Ytd
Canadian automakers reported a collective 4% increase in new vehicle sales, making November 2014 the highest-volume November in the Canadian auto industry's history. Only a short period of December will be required to make 2014 the best year ever...
- Usa Auto Sales Brand Rankings - 2013 Year End
Americans car buyers registered 15.6 million new vehicles in 2013, a significant 7.5% year-over-year increase compared with 2012's twelve months. More new vehicles were purchased and leased in 2013 than in any year since 2007. No manufacturer sold...
- Canada Auto Sales Brand Rankings - December 2013 Ytd
Canadian auto sales in December aren't the stuff that (a salesman's) dreams are made of, as winter and Christmas strike. In 2012, for example, only January and February were lower-volume months. Ford's 5% tumble in December 2013 was produced...
Cars
Canada Auto Sales Brand Rankings - 2014 Year End

• All Vehicles Ranked By December & 2014 Year End Canadian Sales
 |
| Click Chart To Expand |
Canada's top-selling premium brand was Mercedes-Benz. Canadians made the Honda Civic their favourite car for the 17th consecutive year. The Ford F-Series continues to be the top-selling vehicle; the Ford Escape continues to be Canada's best-selling SUV/crossover. The Dodge Grand Caravan earns more than half the minivan market's volume.
If you prefer not to see automakers listed alphabetically, click column headers to sort automakers by 2014 ranking, 2014 sales, year-over-year change, or any other order. Year end best seller lists for cars, trucks, and SUVs will be added later this month. In the coming days, GCBC will also publish a complete list of year end/December sales for every single vehicle line, a list which includes brand results. To find out what you can expect, you can see November's version of that post here. You can always find historical monthly and yearly sales figures for any brand by clicking the brand name in the table below or by selecting a make (or model) at GCBC's Sales Stats page. The + icon has been removed from year-over-year improvements. Look instead for red font to designate year-over-year declines.
Click column headers to sort by specific categories. Using the mobile version of GoodCarBadCar? Switch to the web version at the bottom of the page, at which point columns should be sortable.
2013 Year End • 2012 Year End • 2011 Year End • Updated at 5:23 PM AT on 01.14.2015
Rank | Automaker | 2014 | 2013 | % Change | 2014 Market Share | 2013 Market Share |
|---|---|---|---|---|---|---|
#20 | Acura | 19,533 | 19,005 | 2.8% | 1.1% | 1.1% |
#35 | Alfa Romeo | 2 | --- | --- | 0.1% | 0.0% |
#18 | Audi | 24,514 | 20,506 | 19.5% | 1.3% | 1.2% |
#16 | BMW | 32,805 | 31,710 | 3.5% | 1.8% | 1.8% |
#21 | Buick | 18,745 | 14,310 | 31.0% | 1.0% | 0.8% |
#23 | Cadillac | 10,538 | 9608 | 9.7% | 0.6% | 0.6% |
#4 | Chevrolet | 144,271 | 139,246 | 3.6% | 7.8% | 8.0% |
#17 | Chrysler | 24,716 | 25,466 | -2.9% | 1.3% | 1.5% |
#8 | Dodge | 92,996 | 100,184 | -7.2% | 5.0% | 5.7% |
#25 | Fiat | 8027 | 7710 | 4.1% | 0.4% | 0.4% |
#1 | Ford | 285,004 | 277,637 | 2.7% | 15.4% | 15.9% |
#9 | GMC | 75,246 | 71,781 | 4.8% | 4.1% | 4.1% |
#3 | Honda | 152,893 | 145,231 | 5.3% | 8.3% | 8.3% |
#5 | Hyundai | 138,104 | 137,100 | 0.7% | 7.5% | 7.9% |
#24 | Infiniti | 10,291 | 8947 | 15.0% | 0.6% | 0.5% |
#33 | Jaguar | 1460 | 1263 | 15.6% | 0.1% | 0.1% |
#11 | Jeep | 70,503 | 44,684 | 57.8% | 3.8% | 2.6% |
#12 | Kia | 70,007 | 72,449 | -3.4% | 3.8% | 4.2% |
#27 | Land Rover | 6283 | 5136 | 22.3% | 0.3% | 0.3% |
#22 | Lexus | 17,565 | 15,949 | 10.1% | 0.9% | 0.9% |
#26 | Lincoln | 6819 | 5814 | 17.3% | 0.4% | 0.3% |
#34 | Maserati | 468 | 214 | 119% | 0.1% | 0.1% |
#10 | Mazda | 72,098 | 71,859 | 0.3% | 3.9% | 4.1% |
#15 | Mercedes-Benz ^ | 38,005 | 34,781 | 9.3% | 2.1% | 2.0% |
#28 | Mini | 5383 | 6013 | -10.5% | 0.3% | 0.3% |
#19 | Mitsubishi | 22,704 | 21,104 | 7.6% | 1.2% | 1.2% |
#6 | Nissan | 105,154 | 82,604 | 27.3% | 5.7% | 4.7% |
#29 | Porsche | 4933 | 3680 | 34.0% | 0.3% | 0.2% |
#7 | Ram | 93,760 | 81,971 | 14.4% | 5.1% | 4.7% |
#31 | Scion | 3962 | 4978 | -20.4% | 0.2% | 0.3% |
#32 | Smart | 2550 | 2237 | 14.0% | 0.1% | 0.1% |
#14 | Subaru | 42,035 | 36,760 | 14.3% | 2.3% | 2.1% |
#35 | Suzuki | --- | 3071 | -100% | 0.0% | 0.2% |
#2 | Toyota | 179,324 | 174,432 | 2.8% | 9.7% | 10.0% |
#13 | Volkswagen | 65,677 | 62,668 | 4.8% | 3.5% | 3.6% |
#30 | Volvo | 4466 | 4673 | -4.4% | 0.2% | 0.3% |
--- | --- | --- | --- | --- | --- | --- |
Ford Motor Company | 291,823 | 283,451 | 3.0% | 15.7% | 16.2% | |
Chrysler Group/FCA | 290,004 | 260,015 | 11.5% | 15.7% | 14.9% | |
General Motors | 249,800 | 234,944 | 6.3% | 13.5% | 13.5% | |
Hyundai-Kia | 208,111 | 209,549 | -0.7% | 11.2% | 12.0% | |
Toyota Motor Corporation | 200,851 | 195,360 | 2.8% | 10.8% | 11.2% | |
Honda Motor Company | 172,426 | 164,236 | 5.0% | 9.3% | 9.4% | |
Nissan Motor Company | 115,445 | 91,551 | 26.1% | 6.2% | 5.2% | |
Volkswagen Group * | 95,124 | 87,001 | 9.5% | 5.1% | 5.0% | |
Daimler | 40,555 | 37,018 | 9.6% | 2.2% | 2.1% | |
BMW-Mini | 38,188 | 37,723 | 1.2% | 2.1% | 2.2% | |
Jaguar-Land Rover | 7743 | 6399 | 21.0% | 0.4% | 0.4% | |
--- | --- | --- | --- | --- | --- | --- |
--- | Total | 1,853,001 | 1,745,721 | 6.1% | --- | --- |
Red font indicates declining year-over-year volume
* Does not include Lamborghini
^ Excluding Sprinter: up 8.2% to 33,928.
RECOMMENDED READING
Canada Auto Sales Brand Rankings - 2013 Year End
Canada Auto Sales Brand Rankings - 2012 Year End
Canada Auto Sales Brand Rankings - 2011 Year End
Canada Auto Sales Brand Rankings - December 2014 & Year End
- Canada Auto Sales Brand Rankings - December 2014 And 2014 Year End
Canadian auto sales rose to record levels in calendar year 2014, a strong follow-up to a record-setting year in 2013. • All Vehicles Ranked By December & 2014 Year End Canadian Sales Click Chart To ExpandIn December, specifically, gains...
- Usa Auto Sales Brand Rankings - 2014 Year End
As we update GCBC's December 2014 brand-by-brand results page with U.S. auto sales figures, this page will also be updated with a concentration on the year end numbers alone. • U.S. Vehicle Sales Rankings By Model - 2014 Year End...
- Canada Auto Sales Brand Rankings - November 2014 Ytd
Canadian automakers reported a collective 4% increase in new vehicle sales, making November 2014 the highest-volume November in the Canadian auto industry's history. Only a short period of December will be required to make 2014 the best year ever...
- Usa Auto Sales Brand Rankings - 2013 Year End
Americans car buyers registered 15.6 million new vehicles in 2013, a significant 7.5% year-over-year increase compared with 2012's twelve months. More new vehicles were purchased and leased in 2013 than in any year since 2007. No manufacturer sold...
- Canada Auto Sales Brand Rankings - December 2013 Ytd
Canadian auto sales in December aren't the stuff that (a salesman's) dreams are made of, as winter and Christmas strike. In 2012, for example, only January and February were lower-volume months. Ford's 5% tumble in December 2013 was produced...
