Cars
 Canadian auto sales in December aren't the stuff that (a salesman's) dreams are made of, as winter and Christmas strike. In 2012, for example, only January and February were lower-volume months.
Ford's 5% tumble in December 2013 was produced despite a rise in F-Series sales but in large part because of the Focus's 27% decline which led to the lowest-volume Focus month since January 2010. Chrysler Canada's 5% increase was very much Ram and Jeep-fuelled. GM outsold all other automakers for the first time this year, helped along by GMC's big 23% increase.
The big three's muddled picture continued across an industry that saw BMW rise and Mercedes-Benz fall, Mazda soar and Kia slide sharply, Smart decline and Scion decline more harshly. Combined, the industry's 4% year-over-year increase is in line with that which was achieved over the last twelve months, an industry that's sold 4% more vehicles in 2013 than in 2012.
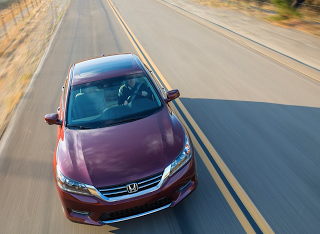
Honda Canada sold just 3412 Civics in December 2013, barely more than half what the company managed a year ago. The Civic generates 44% of Honda brand volume in Canada. Toyota's Scion brand was down 57% in December, and Toyota's year-over-year improvement was slight. Lexus, however, sold more vehicles in Canada than at any time in the company's history.
According to Desrosiers Automotive Reports, passenger cars were responsible for just 38.4% of December's Canadian auto industry volume, as car sales fell 10%. The Canadian outposts of GM, Ford, and Chrysler, meanwhile, owned 42.9% of the market, up slightly from 42.3% in 2012.
Canadians registered more new vehicles in 2013 than in any year in the country's car-buying history. With 1.74 million new vehicle sales, 2013 was a better year, volume-wise, than the previous record-setting year of 2002, when sales barely eclipsed 1.7 million units. In 2012, Canadians purchased or leased just under 1.68 million new vehicles. Auto industry volume in Canada has grown in each of the last four years after sales fell 11% in 2009.
Don't like to see automakers arranged alphabetically? Click column headers to sort automakers by December ranking, December 2013 sales, year-over-year change, or any other order. Best seller lists for cars, trucks, and SUVs will be added in the coming days. GCBC will also publish a complete list of YTD/December sales for every single vehicle line, a list which includes brand results. To find out what you can expect, you can see November's version of that post here. You can always find historical monthly and yearly sales figures for any brand by clicking the brand name in the table below or by selecting a make (or model) at GCBC's Sales Stats page. The + icon has been removed from year-over-year improvements. Look instead for red font to designate year-over-year declines.
Click column headers to sort by specific categories. Using the mobile version of GoodCarBadCar? Switch to the web version at the bottom of the page, at which point columns should be sortable.
December 2014 • January 2014 • November 2013 - December 2012
Updated at 8:44 AM on 01.11.2014
Source: Automakers & ANDC
Red font indicates declining year-over-year volume
* Does not include Lamborghini
^ Excluding Sprinter: down 8.2% to 2661 in December, up 4.2% to 31,357 in 2013
RECOMMENDED READING
Canada Auto Sales Brand Rankings - December 2014 & Year End
Canada Auto Sales Brand Rankings - January 2014
Canada Auto Sales Brand Rankings - November 2013 YTD
Canada Auto Sales Brand Rankings - 2012 Year End
Canada Auto Sales Brand Rankings - December 2012 YTD
Canada Auto Sales Brand Rankings - 2013 Year End
Top 30 Best-Selling Vehicles In Canada - 2013 Year End
- Canada Auto Sales Brand Rankings - November 2014 Ytd
Canadian automakers reported a collective 4% increase in new vehicle sales, making November 2014 the highest-volume November in the Canadian auto industry's history. Only a short period of December will be required to make 2014 the best year ever...
- Canada Auto Sales Brand Rankings - 2013 Year End
While much of this data was already manifest in the December 2013 version of this post, Canada's year-to-date brand rankings as seen here include prior year figures for both total brand volume and brand market share. 2013 was a record year for Canadian...
- Usa Auto Sales Brand Rankings - 2013 Year End
Americans car buyers registered 15.6 million new vehicles in 2013, a significant 7.5% year-over-year increase compared with 2012's twelve months. More new vehicles were purchased and leased in 2013 than in any year since 2007. No manufacturer sold...
- Usa Auto Sales Brand Rankings - December 2013 Ytd
As we anticipated the results from another strong month for the U.S. auto industry, December 2013's early figures supported such a belief. Despite falling Fiat, Chrysler, and Dodge sales, huge growth at Jeep and Ram pushed the Chrysler Group...
- Canada Auto Sales Brand Rankings - November 2013 Ytd
As Enthusiasts Complain, It's Safe To Say Subaru's Mainstreaming Of The WRX Won't Hurt The Company's Sales Next YearManufacturers began reporting their Canadian new vehicle sales totals this morning, as the industry's march toward...
Cars
Canada Auto Sales Brand Rankings - December 2013 YTD
Ford's 5% tumble in December 2013 was produced despite a rise in F-Series sales but in large part because of the Focus's 27% decline which led to the lowest-volume Focus month since January 2010. Chrysler Canada's 5% increase was very much Ram and Jeep-fuelled. GM outsold all other automakers for the first time this year, helped along by GMC's big 23% increase.
The big three's muddled picture continued across an industry that saw BMW rise and Mercedes-Benz fall, Mazda soar and Kia slide sharply, Smart decline and Scion decline more harshly. Combined, the industry's 4% year-over-year increase is in line with that which was achieved over the last twelve months, an industry that's sold 4% more vehicles in 2013 than in 2012.
• All 257 Vehicles Ranked By 2013 Canadian Sales
 |
| Click Chart To Expand |
According to Desrosiers Automotive Reports, passenger cars were responsible for just 38.4% of December's Canadian auto industry volume, as car sales fell 10%. The Canadian outposts of GM, Ford, and Chrysler, meanwhile, owned 42.9% of the market, up slightly from 42.3% in 2012.
Canada Auto Sales Brand Rankings - 2013 Year End
Canadians registered more new vehicles in 2013 than in any year in the country's car-buying history. With 1.74 million new vehicle sales, 2013 was a better year, volume-wise, than the previous record-setting year of 2002, when sales barely eclipsed 1.7 million units. In 2012, Canadians purchased or leased just under 1.68 million new vehicles. Auto industry volume in Canada has grown in each of the last four years after sales fell 11% in 2009.
Don't like to see automakers arranged alphabetically? Click column headers to sort automakers by December ranking, December 2013 sales, year-over-year change, or any other order. Best seller lists for cars, trucks, and SUVs will be added in the coming days. GCBC will also publish a complete list of YTD/December sales for every single vehicle line, a list which includes brand results. To find out what you can expect, you can see November's version of that post here. You can always find historical monthly and yearly sales figures for any brand by clicking the brand name in the table below or by selecting a make (or model) at GCBC's Sales Stats page. The + icon has been removed from year-over-year improvements. Look instead for red font to designate year-over-year declines.
Click column headers to sort by specific categories. Using the mobile version of GoodCarBadCar? Switch to the web version at the bottom of the page, at which point columns should be sortable.
December 2014 • January 2014 • November 2013 - December 2012
Updated at 8:44 AM on 01.11.2014
Rank | Automaker | December 2013 | % Change | 2013 | % Change | December 2013 Market Share | 2013 Market Share |
|---|---|---|---|---|---|---|---|
#17 | Acura | 1774 | -1.6% | 19,005 | 10.8% | 1.6% | 1.1% |
#18 | Audi | 1433 | 0.4% | 20,506 | 2.5% | 1.3% | 1.2% |
#36 | Bentley | 19 | 90.0% | 147 | 16.7% | 0.1% | 0.1% |
#16 | BMW | 2556 | 13.2% | 31,710 | 1.0% | 2.3% | 1.8% |
#21 | Buick | 919 | 34.2% | 14,310 | 9.5% | 0.8% | 0.8% |
#22 | Cadillac | 843 | 50.5% | 9608 | 44.6% | 0.7% | 0.6% |
#4 | Chevrolet | 9239 | 9.1% | 139,245 | 0.2% | 8.2% | 8.0% |
#23 | Chrysler | 769 | -27.1% | 25,466 | 6.7% | 0.7% | 1.5% |
#9 | Dodge | 4925 | -14.1% | 100,184 | 3.2% | 4.3% | 5.7% |
#28 | Fiat | 313 | -30.3% | 7710 | -9.0% | 0.3% | 0.4% |
#1 | Ford | 15,731 | -4.6% | 277,637 | 2.9% | 13.9% | 15.9% |
#7 | GMC | 6035 | 22.9% | 71,781 | 5.8% | 5.3% | 4.1% |
#2 | Honda | 11,542 | 1.2% | 145,231 | 10.4% | 10.2% | 8.3% |
#5 | Hyundai | 7304 | -7.1% | 137,100 | 0.6% | 6.5% | 7.9% |
#25 | Infiniti | 590 | 25.5% | 8947 | 11.9% | 0.5% | 0.5% |
#34 | Jaguar | 88 | 76.0% | 1263 | 96.1% | 0.1% | 0.1% |
#12 | Jeep | 3668 | 55.6% | 44,684 | 4.0% | 3.2% | 2.6% |
#14 | Kia | 2825 | -28.7% | 72,449 | -6.9% | 2.5% | 4.2% |
#26 | Land Rover | 502 | 24.0% | 5136 | 20.3% | 0.4% | 0.3% |
#20 | Lexus | 1189 | 2.1% | 15,949 | 5.6% | 1.1% | 0.9% |
#27 | Lincoln | 422 | 16.6% | 5814 | -5.3% | 0.4% | 0.3% |
#35 | Maserati | 18 | 50.0% | 214 | 32.1% | 0.1% | 0.1% |
#10 | Mazda | 4558 | 28.0% | 71,859 | 0.3% | 4.0% | 4.1% |
#13 | Mercedes-Benz ^ | 2955 | -7.4% | 34,781 | 5.0% | 2.6% | 2.0% |
#24 | Mini | 624 | 33.6% | 6013 | -4.6% | 0.6% | 0.3% |
#19 | Mitsubishi | 1313 | -23.1% | 21,104 | 7.3% | 1.2% | 1.2% |
#6 | Nissan | 6306 | 42.1% | 82,604 | 11.3% | 5.6% | 4.7% |
#30 | Porsche | 279 | 24.6% | 3680 | 22.5% | 0.2% | 0.2% |
#8 | Ram | 5770 | 11.9% | 81,971 | 14.7% | 5.1% | 4.7% |
#32 | Scion | 199 | -56.8% | 4978 | -13.9% | 0.2% | 0.3% |
#33 | Smart | 164 | -18.0% | 2237 | -6.3% | 0.1% | 0.1% |
#15 | Subaru | 2704 | -3.9% | 36,760 | 18.6% | 2.4% | 2.1% |
#29 | Suzuki | 305 | -5.0% | 3071 | -43.7% | 0.3% | 0.2% |
#3 | Toyota | 10,960 | 3.6% | 174,433 | 1.9% | 9.7% | 10.0% |
#11 | Volkswagen | 4078 | 8.0% | 62,668 | 6.0% | 3.6% | 3.6% |
#31 | Volvo | 260 | 0.8% | 4673 | -16.2% | 0.2% | 0.3% |
--- | ----- | ----- | ----- | ----- | ----- | ----- | ----- |
General Motors | 17,036 | 16.5% | 234,944 | 3.6% | 15.1% | 13.5% | |
Ford Motor Company | 16,153 | -4.2% | 283,451 | 2.7% | 14.3% | 16.2% | |
Chrysler Group | 15,445 | 4.7% | 260,015 | 6.6% | 13.6% | 14.9% | |
Honda Motor Company | 13,316 | 0.8% | 164,236 | 10.4% | 11.8% | 9.4% | |
Toyota Motor Corporation | 12,348 | 1.2% | 195,360 | 1.7% | 10.9% | 11.2% | |
Hyundai-Kia | 10,129 | -15.1% | 209,549 | -2.1% | 9.0% | 12.0% | |
Nissan Motor Company | 6896 | 40.5% | 91,551 | 11.4% | 6.1% | 5.2% | |
Volkswagen Group * | 5809 | 6.8% | 87,001 | 5.8% | 5.1% | 5.0% | |
BMW-Mini | 3180 | 16.7% | 37,723 | 0.1% | 2.8% | 2.2% | |
Daimler | 3119 | -8.0% | 37,018 | 4.3% | 2.8% | 2.1% | |
Jaguar-Land Rover | 590 | 29.7% | 6399 | 30.3% | 0.5% | 0.4% | |
--- | --- | --- | --- | --- | --- | --- | --- |
--- | Total | 113,201 | 3.8% | 1,745,188 | 4.0% | --- | --- |
Red font indicates declining year-over-year volume
* Does not include Lamborghini
^ Excluding Sprinter: down 8.2% to 2661 in December, up 4.2% to 31,357 in 2013
RECOMMENDED READING
Canada Auto Sales Brand Rankings - December 2014 & Year End
Canada Auto Sales Brand Rankings - January 2014
Canada Auto Sales Brand Rankings - November 2013 YTD
Canada Auto Sales Brand Rankings - 2012 Year End
Canada Auto Sales Brand Rankings - December 2012 YTD
Canada Auto Sales Brand Rankings - 2013 Year End
Top 30 Best-Selling Vehicles In Canada - 2013 Year End
- Canada Auto Sales Brand Rankings - November 2014 Ytd
Canadian automakers reported a collective 4% increase in new vehicle sales, making November 2014 the highest-volume November in the Canadian auto industry's history. Only a short period of December will be required to make 2014 the best year ever...
- Canada Auto Sales Brand Rankings - 2013 Year End
While much of this data was already manifest in the December 2013 version of this post, Canada's year-to-date brand rankings as seen here include prior year figures for both total brand volume and brand market share. 2013 was a record year for Canadian...
- Usa Auto Sales Brand Rankings - 2013 Year End
Americans car buyers registered 15.6 million new vehicles in 2013, a significant 7.5% year-over-year increase compared with 2012's twelve months. More new vehicles were purchased and leased in 2013 than in any year since 2007. No manufacturer sold...
- Usa Auto Sales Brand Rankings - December 2013 Ytd
As we anticipated the results from another strong month for the U.S. auto industry, December 2013's early figures supported such a belief. Despite falling Fiat, Chrysler, and Dodge sales, huge growth at Jeep and Ram pushed the Chrysler Group...
- Canada Auto Sales Brand Rankings - November 2013 Ytd
As Enthusiasts Complain, It's Safe To Say Subaru's Mainstreaming Of The WRX Won't Hurt The Company's Sales Next YearManufacturers began reporting their Canadian new vehicle sales totals this morning, as the industry's march toward...