Cars
- Luxury Auto Brand Market Share In America - December 2011 And 2011 Year End
Though the second chart in this post seems to make clear that Mercedes-Benz was America's favourite luxury brand, that's not wholly true. Sales of the Mercedes-Benz brand include sales of what used to be a Dodge Sprinter. There were 16,577 of...
- Canada Auto Brand Market Share Charts - December 2011 And 2011 Year End
The Ford Motor Company finished 2011 having accounted for 17.4% of all new vehicle sales in Canada. This was more than two percentage points ahead of General Motors. GM was a little less than one percentage point ahead of Chrysler Canada. Toyota, which...
- Canada Auto Brand Market Share Chart - October 2011
One month ago the September 2011 edition of this Canadian market share post had General Motors at 12.5%, Ford at 19.1%, and the Chrysler Group at 14.2%. Things have changed. Ford lost huge chunks of September's market share as Canadian Blue...
- Canada Auto Brand Market Share Chart - September 2011
General Motors Canada suffered a huge blow as the company's market share slid from 17.8% in August all the way down to 12.5% in September. GM Canada's market share in September of last year was 13.2%. Meanwhile, the Ford Motor Company and...
- U.s. Auto Brand Market Share Chart - September 2011
The Ford Motor Company and General Motors were both able to grow their market share from August to September. Though the gains may've been slim, the increase from 16.3% to 16.6% for Ford and 19.7% to 20.4% for General Motors is still better than what...
Cars
U.S. Auto Brand Market Share Charts - December 2011 And 2011 Year End
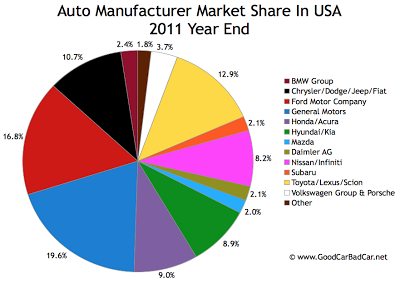
General Motors ended 2011 having conquered 19.6% of the market, approximately one out of every five new vehicle sales in America. Ford trailed with 16.8% market share, Toyota was back at 12.9%, and the Chrysler Groupended 2011 at 10.7%. Detailed sales figures for these companies and their individual brands can be viewed here.
For General Motors, 19.6% marked a slight improvement from 2010's 19.1%. Ford was up narrowly from 16.7% last year. Toyota fell sharply from 2011's 15.2%, a decline of more than two percentage points. The Chrysler Group climbed more than a full percentage point.
Elsewhere, changes were mostly minimal though in certain cases quite meaningful. Honda's decline from 10.6% to 9% is notable. Hyundai/Kia greatly increased their share of the U.S. market from 7.7% to 8.9%. Mazda, Mercedes-Benz, BMW, and Subaru were mostly level. Nissan USA grew its share of the U.S. new vehicle market from 7.8% to 8.2%. The Volkswagen Group was also up just under a half percentage point to 3.7%.
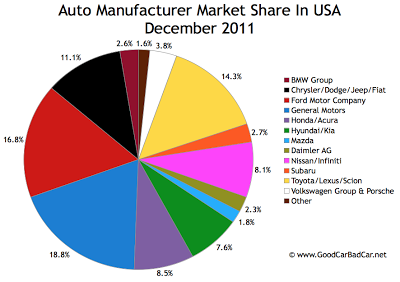
The first chart you see below clarifies the December 2011 situation, details of which can be viewed here. Keep scrolling and click to expand for the 2011 year end edition of America's auto manufacturer market share chart. Specific sales figures for individual models can be seen in recent best seller lists and by accessing the dropdown menu at the top right of this page.
 Related From GoodCarBadCar.net
U.S. Auto Brand Market Share - January 2012
U.S. Auto Sales By Brand - December 2011
U.S. Auto Sales By Brand - 2011 Year End
Auto Brand Market Share Chart - November 2011
Auto Brand Market Share Chart - 2010 Year End
Luxury Auto Brand Market Share In America - Dec. & 2011 Year End
For General Motors, 19.6% marked a slight improvement from 2010's 19.1%. Ford was up narrowly from 16.7% last year. Toyota fell sharply from 2011's 15.2%, a decline of more than two percentage points. The Chrysler Group climbed more than a full percentage point.
Elsewhere, changes were mostly minimal though in certain cases quite meaningful. Honda's decline from 10.6% to 9% is notable. Hyundai/Kia greatly increased their share of the U.S. market from 7.7% to 8.9%. Mazda, Mercedes-Benz, BMW, and Subaru were mostly level. Nissan USA grew its share of the U.S. new vehicle market from 7.8% to 8.2%. The Volkswagen Group was also up just under a half percentage point to 3.7%.
The first chart you see below clarifies the December 2011 situation, details of which can be viewed here. Keep scrolling and click to expand for the 2011 year end edition of America's auto manufacturer market share chart. Specific sales figures for individual models can be seen in recent best seller lists and by accessing the dropdown menu at the top right of this page.
 |
| CLICK EITHER CHART FOR LARGER VIEW |

U.S. Auto Brand Market Share - January 2012
U.S. Auto Sales By Brand - December 2011
U.S. Auto Sales By Brand - 2011 Year End
Auto Brand Market Share Chart - November 2011
Auto Brand Market Share Chart - 2010 Year End
Luxury Auto Brand Market Share In America - Dec. & 2011 Year End
- Luxury Auto Brand Market Share In America - December 2011 And 2011 Year End
Though the second chart in this post seems to make clear that Mercedes-Benz was America's favourite luxury brand, that's not wholly true. Sales of the Mercedes-Benz brand include sales of what used to be a Dodge Sprinter. There were 16,577 of...
- Canada Auto Brand Market Share Charts - December 2011 And 2011 Year End
The Ford Motor Company finished 2011 having accounted for 17.4% of all new vehicle sales in Canada. This was more than two percentage points ahead of General Motors. GM was a little less than one percentage point ahead of Chrysler Canada. Toyota, which...
- Canada Auto Brand Market Share Chart - October 2011
One month ago the September 2011 edition of this Canadian market share post had General Motors at 12.5%, Ford at 19.1%, and the Chrysler Group at 14.2%. Things have changed. Ford lost huge chunks of September's market share as Canadian Blue...
- Canada Auto Brand Market Share Chart - September 2011
General Motors Canada suffered a huge blow as the company's market share slid from 17.8% in August all the way down to 12.5% in September. GM Canada's market share in September of last year was 13.2%. Meanwhile, the Ford Motor Company and...
- U.s. Auto Brand Market Share Chart - September 2011
The Ford Motor Company and General Motors were both able to grow their market share from August to September. Though the gains may've been slim, the increase from 16.3% to 16.6% for Ford and 19.7% to 20.4% for General Motors is still better than what...
