Cars
 With sales data for the first five months of 2013 in the bag, we know that America's appetite for pickup trucks has grown 14.5% compared with the same period in 2012. This far outpaces the industry's growth. Total new vehicle sales are up 7.2%.
 The year's not over, by any means. We don't even get numbers for 2013's halfway point until Tuesday, July 2. However, today seemed like as good a time as any to build a few charts which show the size of the truck market over the last decade. (We threw in 2002 for good measure.) Much has been said, both here at GCBC and elsewhere, about the fast-growing truck market.
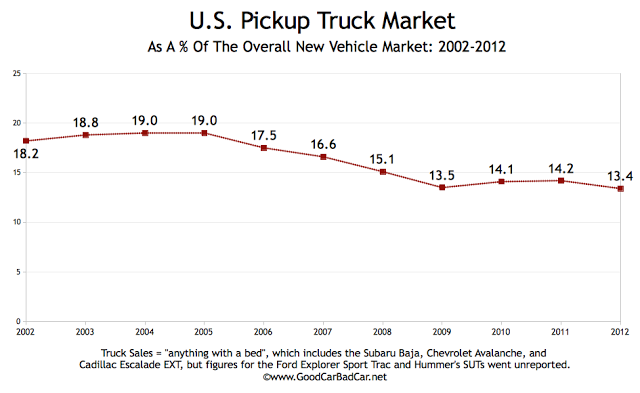
But it's important to keep this in historical context, and not just in the context provided by the most recent history. Truck sales are growing, but they do not account for nearly as much of the industry's volume as they did even in 2011, let alone 2005.
In part, this is a result of a mass departure of truck nameplates. It also reflects the growing acceptance of crossovers and small cars as appropriate family vehicles. Perhaps that desire isn't growing fast - the subcompact boom has slowed - but in comparison with 2004, times have most definitely changed.
Ford F-Series sales are up 22% this year. It accounts for 34.3% of America's truck market, up from 30.6% in 2002, when F-Series sales nearly hit 940,000 units, a couple hundred thousand more than Ford will likely sell this year. In 2002, even when overall new vehicle sales were much higher than they are now, the F-Series collected 5.6% of the industry's volume. That number is down to 4.7% in 2013.
It's not just the departure of most smaller trucks that have played a part in the decline of pickup truck sales. The trucks that remain, even the best-selling F-Series, don't garner the attention they once did.
 Finally, you can click the third chart to measure the sway of Detroit's four main trucks: Ford F-Series, Chevrolet Silverado, GMC Sierra, and Dodge Ram. As a quartet, they own 81.3% of America's truck market in 2013. How has that number changed over the course of the last eleven years? Rather a lot, I reckon.
Pickups used in the construction of this post: Cadillac Escalade EXT, Chevrolet Avalanche, Chevrolet Colorado, Chevrolet S-10, Chevrolet Silverado, Chevrolet SSR, Dodge Dakota, Dodge Ram, Ford F-Series, Ford Ranger, GMC Canyon, GMC Sierra, GMC Sonoma, Honda Ridgeline, Isuzu i-250/i-350, Isuzu Hombre, Lincoln Blackwood, Lincoln Mark LT, Mazda B-Series, Mitsubishi Raider, Nissan Frontier, Nissan Titan, Subaru Baja, Suzuki Equator, Toyota Tacoma, Toyota Tundra. Sales figures for Ford Explorer Sport Trac and Hummer's SUTs were rolled into overarching nameplate totals.
- Complete American Pickup Truck Sales Figures - 2009 Year End
You thought 2008 was bad? U.S. pickup truck sales plunged 30% to fewer than 1.5 million in 2009 as every truck save for the new Suzuki Equator produced sales declines, some of which were disastrous. The U.S. new vehicle industry was down 21% to 10.4...
- Complete American Pickup Truck Sales Figures - 2006 Year End
U.S. pickup truck sales slid 10% in 2006 as the vast majority of truck nameplates posted measurable year-over-year sales decreases. The Ford F-Series continued to lead the way, but Ford lost 105,000 F-Series sales compared with 2005. • Complete...
- Complete American Pickup Truck Sales Figures - 2005 Year End
Pickup truck sales in the United States in 2005 were basically level as the category endured a great deal of change, as the overall new vehicle market grew 0.5%. New trucks arrived at Mitsubishi (the Dakota-based Raider) and Honda (the Odyssey-based Ridgeline)...
- Top 14 Best-selling Trucks In America - June 2013 Ytd
Pickup truck sales in the home of the pickup truck grew 18% in June 2013. U.S. truck sales are up 15% through the first half of 2013. Both these figures for outpace the overall industry's growth. Ford owned 35% of June's U.S. pickup market....
- Top 14 Best-selling Trucks In America - May 2013 Ytd
For the first time since March 2007, Ford sold more than 70,000 F-Series pickup trucks in the United States in a single month. The F-Series ended May 12,260 units ahead of the GM twins - Chevrolet Silverado and GMC Sierra - and owned 36% of the pickup...
Cars
USA Pickup Truck Market: 2002-2012 - Finding Context For Today's Numbers With A Look At Recent History
Trucks currently account for 13.6% of the overall new vehicle market; 13.8% in May, specifically. Those numbers are up from 12.7% in the first five months of 2012, and up from 12.5% last May, when the Ford Ranger, Dodge Dakota, Chevrolet Colorado, GMC Canyon, and Suzuki Equator contributed 23,913 sales, or 2.7% of the truck market's total.
The Ranger and Dakota have died off, and sales of the Colorado, Canyon, and Equator totalled just 4139 this year.
The Ranger and Dakota have died off, and sales of the Colorado, Canyon, and Equator totalled just 4139 this year.
But it's important to keep this in historical context, and not just in the context provided by the most recent history. Truck sales are growing, but they do not account for nearly as much of the industry's volume as they did even in 2011, let alone 2005.
In part, this is a result of a mass departure of truck nameplates. It also reflects the growing acceptance of crossovers and small cars as appropriate family vehicles. Perhaps that desire isn't growing fast - the subcompact boom has slowed - but in comparison with 2004, times have most definitely changed.
Ford F-Series sales are up 22% this year. It accounts for 34.3% of America's truck market, up from 30.6% in 2002, when F-Series sales nearly hit 940,000 units, a couple hundred thousand more than Ford will likely sell this year. In 2002, even when overall new vehicle sales were much higher than they are now, the F-Series collected 5.6% of the industry's volume. That number is down to 4.7% in 2013.
It's not just the departure of most smaller trucks that have played a part in the decline of pickup truck sales. The trucks that remain, even the best-selling F-Series, don't garner the attention they once did.
The sheer size of the American pickup truck market is definitely only part of the equation. It's certainly relevant, as the impact of increasing or decreasing volume is keenly felt across the United States. But as a tool to measure the desire for pickup trucks, the size of the truck market relative to the overall market is just as pertinent. So in the second chart, you can see the impact trucks have on the overall automotive sphere.
Pickups used in the construction of this post: Cadillac Escalade EXT, Chevrolet Avalanche, Chevrolet Colorado, Chevrolet S-10, Chevrolet Silverado, Chevrolet SSR, Dodge Dakota, Dodge Ram, Ford F-Series, Ford Ranger, GMC Canyon, GMC Sierra, GMC Sonoma, Honda Ridgeline, Isuzu i-250/i-350, Isuzu Hombre, Lincoln Blackwood, Lincoln Mark LT, Mazda B-Series, Mitsubishi Raider, Nissan Frontier, Nissan Titan, Subaru Baja, Suzuki Equator, Toyota Tacoma, Toyota Tundra. Sales figures for Ford Explorer Sport Trac and Hummer's SUTs were rolled into overarching nameplate totals.
RECOMMENDED READING
Top 14 Best-Selling Trucks In America - May 2013 YTD
U.S. Auto Sales Brand Rankings - May 2013 YTD
Historical Monthly & Yearly U.S. Total Auto Market Volume
Historical Monthly & Yearly Ford F-Series Sales
- Complete American Pickup Truck Sales Figures - 2009 Year End
You thought 2008 was bad? U.S. pickup truck sales plunged 30% to fewer than 1.5 million in 2009 as every truck save for the new Suzuki Equator produced sales declines, some of which were disastrous. The U.S. new vehicle industry was down 21% to 10.4...
- Complete American Pickup Truck Sales Figures - 2006 Year End
U.S. pickup truck sales slid 10% in 2006 as the vast majority of truck nameplates posted measurable year-over-year sales decreases. The Ford F-Series continued to lead the way, but Ford lost 105,000 F-Series sales compared with 2005. • Complete...
- Complete American Pickup Truck Sales Figures - 2005 Year End
Pickup truck sales in the United States in 2005 were basically level as the category endured a great deal of change, as the overall new vehicle market grew 0.5%. New trucks arrived at Mitsubishi (the Dakota-based Raider) and Honda (the Odyssey-based Ridgeline)...
- Top 14 Best-selling Trucks In America - June 2013 Ytd
Pickup truck sales in the home of the pickup truck grew 18% in June 2013. U.S. truck sales are up 15% through the first half of 2013. Both these figures for outpace the overall industry's growth. Ford owned 35% of June's U.S. pickup market....
- Top 14 Best-selling Trucks In America - May 2013 Ytd
For the first time since March 2007, Ford sold more than 70,000 F-Series pickup trucks in the United States in a single month. The F-Series ended May 12,260 units ahead of the GM twins - Chevrolet Silverado and GMC Sierra - and owned 36% of the pickup...