Cars
 GCBC has already posted early December 2012 U.S. sales figures for a number of brands, and although those numbers are important, this 2012 Year End U.S. Auto Sales Brand Rankings post is the one that most people will come to see.
Through the end of November, U.S. auto sales had risen 14%. The jump in December appears to be a little below 10%, so we're looking at, approximately speaking, a 13% jump in U.S. new vehicle sales in 2012.
Much of that increase has been provided by Honda and Toyota, automakers which suffered greatly in 2011. But vehicles like the eminently popular Ford F-Series, the Ford Focus, America's best-selling American-badged car, the Mercedes-Benz C-Class, and even the Jeep Wrangler have produced tremendous improvements, as well.
Sans Sprinter, Mercedes-Benz lost the luxury brand war by 7506 sales. BMW had a huge December. Ford was America's most popular brand, although General Motors sells more cars than FoMoCo.
Huge gains were posted by individual brands like Chrysler, Scion, Fiat, and smart. Toyota added 367,995 sales to its total. Declines were rare but notable: Lincoln is in a terrible place, and its crosstown rival, Cadillac, had a rough year but a terrific end to that year. Oh, and Suzuki slid, as well, so far that the brand is now defunct in the United States. GSX-R for the win. And Jaguar, but Jaguar hardly counts. And Mitsubishi. Which is probably the next Suzuki.
Brands are ranked by 2012 twelve month totals. 2012 is over, and more than 14 million new vehicles were sold in the United States. There'll be a market share chart here for you to examine here shortly and best seller lists will be posted soon, too.
Updated at 4:58 PM AT on 01.03.2012
Source: Automakers & ANDC
* Total Does Not Include Lamborghini
Related From GoodCarBadCar.net
U.S. Auto Sales Brand Rankings - 2013 Year End
U.S. Auto Sales Brand Rankings - January 2013
U.S. Auto Sales Brand Rankings - December 2012
U.S. Auto Sales Brand Rankings - November 2012
U.S. Auto Sales Brand Rankings - 2011 Year End
U.S. Auto Sales Brand Rankings - 2010 Year End
Top 25 Best-Selling SUVs In America - 2012 Year End
- Usa Auto Sales Brand Rankings - 2013 Year End
Americans car buyers registered 15.6 million new vehicles in 2013, a significant 7.5% year-over-year increase compared with 2012's twelve months. More new vehicles were purchased and leased in 2013 than in any year since 2007. No manufacturer sold...
- 2012 Year End Canada Auto Sales Brand Rankings
In spite of a terrible December in which three of Canada's four top-selling brands suffered noteworthy sales declines, Canadians purchased or leased 90,000 more new vehicles in 2012 than in 2011. As usual, Canada's monthly reporting of...
- December 2012 Canada Auto Sales By Brand
The Rio Has Been A Huge Part Of Kia Canada's Growth In 2012. Kia Rose 19.5% In 2012. 13,949 of The Brand's Volume Was Rio-Derived.Early December 2012 Canadian auto sales figures from Chrysler show a mixed bag, not unlike that which we'll likely...
- November 2012 United States Auto Sales By Brand
Honda's Huge Gains Were Expected. This 2013 Civic Should Offer Another Big Boost In December And Early Next Year.Automakers began reporting their November 2012 U.S. sales results early this morning. We were expecting to see strong increases reported...
- Domestics Vs. Imports - U.s. Auto Market Share Through Three Quarters Of 2012
American Auto Brands Market Share Click Any Chart For A Larger ViewPie charts: an essential ingredient in any recipe for successful sales analysis. Today we're looking at the U.S. auto industry in the first three quarters of 2012. How does the volume...
Cars
2012 Year End United States Auto Sales Brand Rankings

Through the end of November, U.S. auto sales had risen 14%. The jump in December appears to be a little below 10%, so we're looking at, approximately speaking, a 13% jump in U.S. new vehicle sales in 2012.
December 2012 U.S. Auto Sales Brand Rankings
Much of that increase has been provided by Honda and Toyota, automakers which suffered greatly in 2011. But vehicles like the eminently popular Ford F-Series, the Ford Focus, America's best-selling American-badged car, the Mercedes-Benz C-Class, and even the Jeep Wrangler have produced tremendous improvements, as well.
Sans Sprinter, Mercedes-Benz lost the luxury brand war by 7506 sales. BMW had a huge December. Ford was America's most popular brand, although General Motors sells more cars than FoMoCo.
All 266 Vehicles Ranked By 2012 Year End U.S. Sales
 |
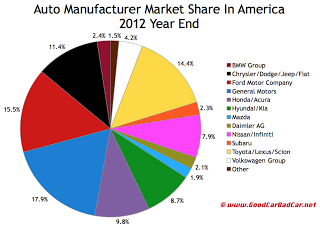
| Click Market Share Chart For Larger View |
Brands are ranked by 2012 twelve month totals. 2012 is over, and more than 14 million new vehicles were sold in the United States. There'll be a market share chart here for you to examine here shortly and best seller lists will be posted soon, too.
Updated at 4:58 PM AT on 01.03.2012
Rank | Automaker | 2012 Year End | 2011 Year End | % Change |
#1 | Ford | 2,160,859 | 2,057,210 | + 5.0% |
#2 | Chevrolet | 1,851,646 | 1,775,802 | + 4.3% |
#3 | Toyota | 1,764,833 | 1,396,838 | + 26.3% |
#4 | Honda | 1,266,569 | 1,023,986 | + 23.7% |
#5 | Nissan | 1,021,779 | 944,073 | + 8.2% |
#6 | Hyundai | 703,007 | 645,691 | + 8.9% |
#7 | Kia | 557,599 | 485,492 | + 14.9% |
#8 | Dodge | 524,989 | 451,040 | + 16.4% |
#9 | Jeep | 474,131 | 419,349 | + 13.1% |
#10 | Volkswagen | 438,133 | 324,402 | + 35.1% |
#11 | GMC | 413,881 | 397,973 | + 4.0% |
#12 | Subaru | 336,441 | 266,989 | + 26.0% |
#13 | Chrysler | 307,967 | 221,346 | + 39.1% |
#14 | Ram | 300,928 | 257,610 | + 16.8% |
#15 | Mercedes-Benz | 295,063 | 261,769 | + 12.7% |
#16 | BMW | 281,460 | 247,907 | + 13.5% |
#17 | Mazda | 277,046 | 250,426 | + 10.6% |
#18 | Lexus | 244,166 | 198,552 | + 23.0% |
#19 | Buick | 180,408 | 177,633 | + 1.6% |
#20 | Acura | 156,216 | 123,299 | + 26.7% |
#21 | Cadillac | 149,782 | 152,389 | - 1.7% |
#22 | Audi | 139,310 | 117,561 | + 18.5% |
#23 | Infiniti | 119,877 | 98,461 | + 21.8% |
#24 | Lincoln | 82,150 | 85,463 | - 4.1% |
#25 | Scion | 73,505 | 49,271 | + 49.2% |
#26 | Volvo | 68,117 | 67,240 | + 1.3% |
#27 | Mini | 66,123 | 57,511 | + 15.0% |
#28 | Mitsubishi | 57,790 | 79,020 | - 26.9% |
#29 | Fiat | 43,772 | 19,769 | + 121% |
#30 | Land Rover | 43,664 | 38,099 | + 14.6% |
#31 | Porsche | 35,043 | 29,023 | + 20.7% |
#32 | Suzuki | 25,357 | 26,618 | - 4.7% |
#33 | Jaguar | 12,011 | 12,276 | - 2.2% |
#34 | smart | 10,009 | 5208 | + 68.9% |
#35 | Maserati | 2730 | 2321 | + 17.6% |
#36 | Bentley | 2315 | 1877 | + 23.3% |
--- | ----- | ----- | ----- | ----- |
General Motors | 2,595,717 | 2,503,797 | + 3.7% | |
Ford Motor Company | 2,243,009 | 2,143,101 | + 4.7% | |
Toyota Motor Corporation | 2,082,504 | 1,644,660 | + 26.6% | |
Chrysler Group | 1,651,787 | 1,369,114 | + 20.6% | |
American Honda | 1,422,785 | 1,147,285 | + 24.0% | |
Hyundai-Kia | 1,260,606 | 1,131,183 | + 11.4% | |
Nissan USA | 1,141,656 | 1,042,534 | + 9.5% | |
Volkswagen Group * | 614,801 | 472,863 | + 30.0% | |
| BMW-Mini | 347,583 | 305,418 | + 13.8% | |
| Daimler AG | 305,072 | 267,016 | + 14.3% | |
| Jaguar-Land Rover | 55,675 | 50,375 | + 10.5% | |
--- | ----- | ----- | ----- | ----- |
Total | 14,492,398 | 12,779,007 | + 13.4% |
* Total Does Not Include Lamborghini
Related From GoodCarBadCar.net
U.S. Auto Sales Brand Rankings - 2013 Year End
U.S. Auto Sales Brand Rankings - January 2013
U.S. Auto Sales Brand Rankings - December 2012
U.S. Auto Sales Brand Rankings - November 2012
U.S. Auto Sales Brand Rankings - 2011 Year End
U.S. Auto Sales Brand Rankings - 2010 Year End
Top 25 Best-Selling SUVs In America - 2012 Year End
- Usa Auto Sales Brand Rankings - 2013 Year End
Americans car buyers registered 15.6 million new vehicles in 2013, a significant 7.5% year-over-year increase compared with 2012's twelve months. More new vehicles were purchased and leased in 2013 than in any year since 2007. No manufacturer sold...
- 2012 Year End Canada Auto Sales Brand Rankings
In spite of a terrible December in which three of Canada's four top-selling brands suffered noteworthy sales declines, Canadians purchased or leased 90,000 more new vehicles in 2012 than in 2011. As usual, Canada's monthly reporting of...
- December 2012 Canada Auto Sales By Brand
The Rio Has Been A Huge Part Of Kia Canada's Growth In 2012. Kia Rose 19.5% In 2012. 13,949 of The Brand's Volume Was Rio-Derived.Early December 2012 Canadian auto sales figures from Chrysler show a mixed bag, not unlike that which we'll likely...
- November 2012 United States Auto Sales By Brand
Honda's Huge Gains Were Expected. This 2013 Civic Should Offer Another Big Boost In December And Early Next Year.Automakers began reporting their November 2012 U.S. sales results early this morning. We were expecting to see strong increases reported...
- Domestics Vs. Imports - U.s. Auto Market Share Through Three Quarters Of 2012
American Auto Brands Market Share Click Any Chart For A Larger ViewPie charts: an essential ingredient in any recipe for successful sales analysis. Today we're looking at the U.S. auto industry in the first three quarters of 2012. How does the volume...
