Cars
 American new car buyers were expected to register approximately 12% more new vehicles in October 2013 than in October 2012. September's market wasn't especially strong, and October was hampered to a small degree by a government shutdown which disturbed consumer confidence. Nevertheless, a 12% improvement in October 2013 would have spoken loudly after 7% increases in October 2012 and October 2011.
In the end, October sales grew 10.4%, a slightly slower rate of growth than expected, but still better than what we've typically been seeing from the industry this year. Through ten months, the U.S. auto industry's sales volume is up 8% to just under 13 million units. You may recall that Americans registered fewer than 13 million new vehicles in 2009, 2010, and again in 2011.
General Motors, America's leading manufacturer, reported a 16% increase in volume as all four brands increased in October. Declines among specific models were rare, although the Chevrolet Volt took a 32% hit and is down 3% year-to-date.
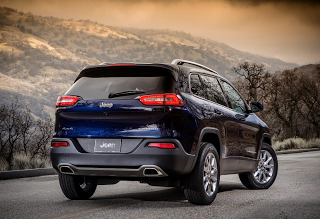
The Chrysler Group has already sold 1.5 million new vehicles in 2013; more than they managed in 2008, 2009, 2010, or 2011. Jeep reported its first 579 Cherokee sales in October and produced gains of 7% despite the loss of 4099 Libertys.
Ford MoCo volume shot up 14% to nearly 192,000 sales in October as the F-Series topped 60,000 units for the sixth consecutive month and Ford brand car sales rose 16.5%.
More info below the results.
Don't like to see automakers arranged alphabetically? Click column headers to sort automakers by October ranking, October 2013 sales, year-over-year change, or any other order. Best seller lists for cars, trucks, and SUVs will be added later this afternoon. You can always find historical monthly and yearly sales figures for any brand by clicking the brand name in the table below or by selecting a make (or model) at GCBC's Sales Stats page. The + icon has been removed from year-over-year improvements. Look instead for red font to designate year-over-year declines.
Click column headers to sort by specific categories. Using the mobile version of GoodCarBadCar? Switch to the web version at the bottom of the page, at which point columns should be sortable.
October 2014 • November 2013 • September 2013 • October 2012 • Updated at 3:53 PM AT on 11.01.2013
Source: Automakers & ANDC
Red font indicates declining year-over-year volume
*Does not include Lamborghini
* Sans Sprinter, Mercedes-Benz USA was up 25.4% to 30,069 in October, up 13.7% to 245,125 year-to-date.
Hyundai volume rose by 3284 units in October thanks to another big jump from the Santa Fe and an 18% uptick in Elantra volume. Volkswagen's very disappointing 18% decline came as Golf sales plunged 23%, Jetta volume slid 13%, and Passat sales slid 13%. While Volkswagen tumbled, the VW Group's second-best-selling brand, Audi, posted a YOY improvement of 11%. The Q5 was a gain a leader, rising 39% to 3380 units. Porsche generated six out of every ten sales with the Cayenne and Panamera.
Subaru, formerly a niche automakers, outsold Volkswagen - which plans to rule the world - by 6354 units in America in October and leads Volkswagen by nearly 5000 sales through ten months. An expanded XF lineup helped Jaguar more than double sales to 1515 units, more than Jaguar managed last October and November combined. Land Rover sold 1184 Range Rovers, nearly triple last October's total.
Mazda 3 sales fell 19% as leftover 2013 3s and all-new 2014 3s competed for attention. Mazda 6 sales doubled. Mitsubishi added 991 sales to the U.S. auto industry in October, which isn't something we're accustomed to saying. Mini's Countryman was again the company's best-selling variant, outselling the conventional Cooper Hardtop by 560 units. BMW relied on Mini for 17% of all BMW-Mini volume in October, down from 18% a year ago. BMW was outsold by the Mercedes-Benz brand (Sprinter-excluded) by 2495 units in October. 4895 of the Benzes sold were entry-level CLA sedans.
Kia's declines continue: October marked the fifth in 2013's ten months. 66% of the vehicles sold by American Honda, including Acuras, were Civics, Accords, and CR-Vs. Toyota, the provider of America's best-selling car, say they sold 92,026 passenger cars across three brands in October, a 3% increase. Volvo's decline was its seven this year and its third consecutive drop.
RECOMMENDED READING
U.S. Auto Sales Brand Rankings - October 2014 YTD
U.S. Auto Sales Brand Rankings - November 2013 YTD
U.S. Auto Sales Brand Rankings - September 2013 YTD
U.S. Auto Sales Brand Rankings - October 2012 YTD
U.S. Auto Sales Brand Rankings - 2012 Year End
Top 30 Best-Selling Vehicles In America - October 2013
Historical U.S. Monthly/Yearly Overall Industry Totals
- Usa Auto Sales Brand Rankings - October 2014 Ytd
Early results from Nissan support the belief that October 2014 was a high-volume month for automakers in the United States. Nissan brand sales jumped 15% to 94,072 units and have already climbed beyond 1M units through ten months, a 130,000-uit improvement...
- Usa Auto Sales Brand Rankings - November 2013 Ytd
A healthy month for the U.S. auto industry in November 2013 was expected to be fuelled by a surge in Black Friday luxury car sales and by, as we've consistently heard, pent-up demand. Automakers have certainly anticipated greater sales, as there are...
- Mini Usa Car Sales Charts - October 2013 Ytd
Sales at BMW's Mini brand fell 3% in October 2013 even as the overall auto industry reported a 10% improvement. Mini's decline, equal to 188 fewer sales in October 2013 than in October 2012, came as a result of falling sales from every model save...
- Canada Auto Sales Brand Rankings - October 2013 Ytd
October Was The Best Canadian Ford Escape Sales Month Since July 2012Early signs pointed to a healthy month for Canada's startlingly strong automobile marketplace. Ford Motor Company, Canada's largest manufacturer, and the Ford brand, Canada's...
- Canada Auto Sales Brand Rankings - September 2013 Ytd
Canada's most popular automobile manufacturer and its best-selling brand, the top-ranked auto brand in Canada, posted a significant year-over-year improvement in September 2013. F-Series trucks rose 27%, good enough for the truck lineup's best...
Cars
USA Auto Sales Brand Rankings - October 2013 YTD
In the end, October sales grew 10.4%, a slightly slower rate of growth than expected, but still better than what we've typically been seeing from the industry this year. Through ten months, the U.S. auto industry's sales volume is up 8% to just under 13 million units. You may recall that Americans registered fewer than 13 million new vehicles in 2009, 2010, and again in 2011.
• Top 20 Best-Selling Cars In America - October 2013
• All Vehicles Ranked By October 2013 & YTD U.S. Sales
• All Vehicles Ranked By October 2013 & YTD U.S. Sales
 |
| Click Market Share Chart For Larger View |
The Chrysler Group has already sold 1.5 million new vehicles in 2013; more than they managed in 2008, 2009, 2010, or 2011. Jeep reported its first 579 Cherokee sales in October and produced gains of 7% despite the loss of 4099 Libertys.
Ford MoCo volume shot up 14% to nearly 192,000 sales in October as the F-Series topped 60,000 units for the sixth consecutive month and Ford brand car sales rose 16.5%.
More info below the results.
Don't like to see automakers arranged alphabetically? Click column headers to sort automakers by October ranking, October 2013 sales, year-over-year change, or any other order. Best seller lists for cars, trucks, and SUVs will be added later this afternoon. You can always find historical monthly and yearly sales figures for any brand by clicking the brand name in the table below or by selecting a make (or model) at GCBC's Sales Stats page. The + icon has been removed from year-over-year improvements. Look instead for red font to designate year-over-year declines.
Click column headers to sort by specific categories. Using the mobile version of GoodCarBadCar? Switch to the web version at the bottom of the page, at which point columns should be sortable.
October 2014 • November 2013 • September 2013 • October 2012 • Updated at 3:53 PM AT on 11.01.2013
Rank | Automaker | October 2013 | % Change | 2013 YTD | YTD % Change | October 2013 Market Share | YTD Market Share |
|---|---|---|---|---|---|---|---|
#21 | Acura | 14,296 | 17.5% | 135,126 | 5.6% | 1.2% | 1.0% |
#22 | Audi | 13,000 | 11.0% | 127,412 | 13.4% | 1.1% | 1.0% |
#35 | Bentley | 340 | 53.2% | 2199 | 17.8% | 0.03% | 0.02% |
#15 | BMW | 27,574 | 4.2% | 240,139 | 12.8% | 2.3% | 1.9% |
#19 | Buick | 17,555 | 31.2% | 175,058 | 16.2% | 1.5% | 1.3% |
#20 | Cadillac | 14,792 | 9.5% | 148,206 | 26.7% | 1.2% | 1.1% |
#2 | Chevrolet | 155,214 | 14.7% | 1,648,543 | 6.0% | 12.9% | 12.7% |
#16 | Chrysler | 23,452 | 5.5% | 261,198 | - 0.9% | 1.9% | 2.0% |
#7 | Dodge | 45,314 | 11.6% | 507,148 | 17.3% | 3.8% | 3.9% |
#30 | Fiat | 3674 | - 1.2% | 36,416 | - 0.1% | 0.3% | 0.3% |
#1 | Ford | 184,136 | 13.1% | 2,011,956 | 12.8% | 15.3% | 15.5% |
#9 | GMC | 38,841 | 15.7% | 372,054 | 9.4% | 3.2% | 2.9% |
#4 | Honda | 100,242 | 5.7% | 1,138,424 | 8.9% | 8.3% | 8.8% |
#6 | Hyundai | 53,555 | 6.5% | 601,773 | 2.0% | 4.4% | 4.6% |
#23 | Infiniti | 9152 | 4.5% | 90,071 | - 5.5% | 0.8% | 0.7% |
#32 | Jaguar | 1515 | 117% | 13,962 | 36.2% | 0.1% | 0.1% |
#10 | Jeep | 36,379 | 6.9% | 391,764 | - 1.9% | 3.0% | 3.0% |
#8 | Kia | 39,754 | - 6.4% | 456,137 | - 4.4% | 3.3% | 3.5% |
#28 | Land Rover | 4286 | 37.0% | 39,645 | 13.9% | 0.4% | 0.3% |
#17 | Lexus | 22,719 | 14.5% | 213,479 | 11.9% | 1.9% | 1.6% |
#24 | Lincoln | 7131 | 38.4% | 66,983 | - 3.0% | 0.6% | 0.5% |
#33 | Maserati | 587 | 186% | 2828 | 29.2% | 0.05% | 0.02% |
#18 | Mazda | 19,738 | 6.0% | 240,229 | 5.3% | 1.6% | 1.9% |
#12 | Mercedes-Benz * | 32,107 | 25.2% | 262,103 | 12.7% | 2.7% | 2.0% |
#25 | Mini | 5700 | - 3.2% | 55,335 | 1.7% | 0.5% | 0.4% |
#26 | Mitsubishi | 4972 | 24.9% | 49,953 | - 0.3% | 0.4% | 0.4% |
#5 | Nissan | 81,866 | 15.4% | 942,063 | 10.7% | 6.8% | 7.3% |
#31 | Porsche | 3562 | 10.9% | 35,111 | 24.4% | 0.3% | 0.3% |
#13 | Ram | 31,264 | 22.1% | 300,560 | 22.7% | 2.6% | 2.3% |
#27 | Scion | 4940 | - 16.1% | 59,030 | - 5.4% | 0.4% | 0.5% |
#34 | Smart | 513 | - 48.6% | 7450 | - 10.3% | 0.04% | 0.06% |
#11 | Subaru | 34,483 | 32.0% | 347,890 | 28.1% | 2.9% | 2.7% |
#36 | Suzuki | --- | - 100% | --- | - 71.9% | --- | --- |
#3 | Toyota | 141,317 | 9.1% | 1,594,646 | 8.2% | 11.7% | 12.3% |
#14 | Volkswagen | 28,129 | - 18.0% | 342,962 | - 4.0% | 2.3% | 2.6% |
#29 | Volvo | 3919 | - 6.7% | 52,112 | - 6.7% | 0.3% | 0.4% |
--- | ----- | ----- | ----- | ----- | ----- | ----- | ----- |
General Motors | 226,402 | 15.7% | 2,343,861 | 8.3% | 18.8% | 18.1% | |
Ford Motor Company | 191,267 | 13.9% | 2,078,939 | 12.2% | 15.9% | 16.0% | |
Toyota Motor Corporation | 168,976 | 8.8% | 1,867,155 | 8.1% | 14.0% | 14.4% | |
Chrysler Group | 140,083 | 11.0% | 1,497,086 | 8.7% | 11.6% | 11.5% | |
Honda Motor Company | 114,538 | 7.1% | 1,273,550 | 8.5% | 9.5% | 9.8% | |
Hyundai-Kia | 93,309 | 0.6% | 1,057,910 | - 0.9% | 7.7% | 8.2% | |
Nissan Motor Company | 91,018 | 14.2% | 1,032,134 | 9.1% | 7.5% | 8.0% | |
Volkswagen Group * | 45,032 | - 8.9% | 508,144 | 1.6% | 3.7% | 3.9% | |
BMW-Mini | 33,274 | 2.9% | 295,474 | 10.6% | 2.8% | 2.3% | |
Daimler | 32,620 | 22.4% | 269,553 | 11.9% | 2.7% | 2.1% | |
Jaguar-Land Rover | 5801 | 51.5% | 53,607 | 19.0% | 0.5% | 0.4% | |
--- | ----- | ----- | ----- | ----- | ----- | ----- | ----- |
--- | Total Market | 1,206,182 | 10.4% | 12,979,521 | 8.2% | --- | --- |
Red font indicates declining year-over-year volume
*Does not include Lamborghini
* Sans Sprinter, Mercedes-Benz USA was up 25.4% to 30,069 in October, up 13.7% to 245,125 year-to-date.
Hyundai volume rose by 3284 units in October thanks to another big jump from the Santa Fe and an 18% uptick in Elantra volume. Volkswagen's very disappointing 18% decline came as Golf sales plunged 23%, Jetta volume slid 13%, and Passat sales slid 13%. While Volkswagen tumbled, the VW Group's second-best-selling brand, Audi, posted a YOY improvement of 11%. The Q5 was a gain a leader, rising 39% to 3380 units. Porsche generated six out of every ten sales with the Cayenne and Panamera.
Subaru, formerly a niche automakers, outsold Volkswagen - which plans to rule the world - by 6354 units in America in October and leads Volkswagen by nearly 5000 sales through ten months. An expanded XF lineup helped Jaguar more than double sales to 1515 units, more than Jaguar managed last October and November combined. Land Rover sold 1184 Range Rovers, nearly triple last October's total.
Mazda 3 sales fell 19% as leftover 2013 3s and all-new 2014 3s competed for attention. Mazda 6 sales doubled. Mitsubishi added 991 sales to the U.S. auto industry in October, which isn't something we're accustomed to saying. Mini's Countryman was again the company's best-selling variant, outselling the conventional Cooper Hardtop by 560 units. BMW relied on Mini for 17% of all BMW-Mini volume in October, down from 18% a year ago. BMW was outsold by the Mercedes-Benz brand (Sprinter-excluded) by 2495 units in October. 4895 of the Benzes sold were entry-level CLA sedans.
Kia's declines continue: October marked the fifth in 2013's ten months. 66% of the vehicles sold by American Honda, including Acuras, were Civics, Accords, and CR-Vs. Toyota, the provider of America's best-selling car, say they sold 92,026 passenger cars across three brands in October, a 3% increase. Volvo's decline was its seven this year and its third consecutive drop.
U.S. Auto Sales Brand Rankings - October 2014 YTD
U.S. Auto Sales Brand Rankings - November 2013 YTD
U.S. Auto Sales Brand Rankings - September 2013 YTD
U.S. Auto Sales Brand Rankings - October 2012 YTD
U.S. Auto Sales Brand Rankings - 2012 Year End
Top 30 Best-Selling Vehicles In America - October 2013
Historical U.S. Monthly/Yearly Overall Industry Totals
- Usa Auto Sales Brand Rankings - October 2014 Ytd
Early results from Nissan support the belief that October 2014 was a high-volume month for automakers in the United States. Nissan brand sales jumped 15% to 94,072 units and have already climbed beyond 1M units through ten months, a 130,000-uit improvement...
- Usa Auto Sales Brand Rankings - November 2013 Ytd
A healthy month for the U.S. auto industry in November 2013 was expected to be fuelled by a surge in Black Friday luxury car sales and by, as we've consistently heard, pent-up demand. Automakers have certainly anticipated greater sales, as there are...
- Mini Usa Car Sales Charts - October 2013 Ytd
Sales at BMW's Mini brand fell 3% in October 2013 even as the overall auto industry reported a 10% improvement. Mini's decline, equal to 188 fewer sales in October 2013 than in October 2012, came as a result of falling sales from every model save...
- Canada Auto Sales Brand Rankings - October 2013 Ytd
October Was The Best Canadian Ford Escape Sales Month Since July 2012Early signs pointed to a healthy month for Canada's startlingly strong automobile marketplace. Ford Motor Company, Canada's largest manufacturer, and the Ford brand, Canada's...
- Canada Auto Sales Brand Rankings - September 2013 Ytd
Canada's most popular automobile manufacturer and its best-selling brand, the top-ranked auto brand in Canada, posted a significant year-over-year improvement in September 2013. F-Series trucks rose 27%, good enough for the truck lineup's best...