Cars
 Not unexpectedly UK auto sales volume skyrocketed in September. From August levels, the United Kingdom's most popular brand, Ford, saw its sales rise 407%.
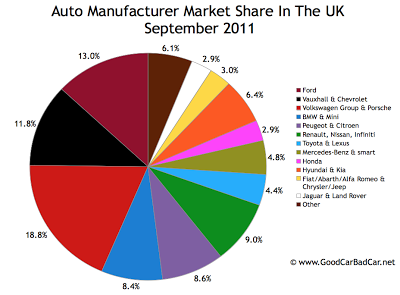
Year-over-year, however, Ford was down 6.6%. And as you'll see in the pie chart at the bottom of this post, Ford may be the most popular individual brand but still loses out in market share terms to the massive Volkswagen Group.
Volkswagen, including its subsidiaries and Porsche partner, saw its market share fall from 21.9% in August to 18.8% in September 2011. Sales of the Volkswagen brand were up 18.4%, year-over-year. Audi reported a 17% improvement. Skoda was up 27.2%, SEAT was up 22.9%, Porsche jumped 52.6%, and little ol' Bentley was down 4.3%, or six units. During a month in which 51% of brands reported declining volume compared with September 2010, only 16% of the Volkswagen Group's brands did so. Audi was the UK's best-selling premium brand in September and leads BMW by 1597 sales through the first three-quarters of 2011.
We could spend time considering how much Honda struggles in the United Kingdom - quake-related inventory issues have caused problems for Honda all over the world - or how strange it is to see Chevrolet ranked 25th. We North Americans are accustomed to seeing Chevrolet battling for top spot. Instead, let's analyze the relative power of British brands. Or brands which were once British owned.
For the sake of sticking to automakers we're acquainted with as niche brands, let's exclude Vauxhall. Combined sales at Mini, Land Rover, Jaguar, Aston Martin, Bentley, MG, Lotus, and brands the SMMT refers to as "Other British" totalled 19,703 in September. That's 5.9% of the UK new vehicle market, a figure Hyundai/Kia can better. However, those same British brands only owned just 0.77% of the U.S. new vehicle market. The Union Jack still inspires some automotive loyalty.
The September 2011 table listing all automobile brands competing for sales in the United Kingdom is below. Scroll down a little more for the market share chart.
Source: Automakers & SMMT
Related From GoodCarBadCar.net
United Kingdom Auto Sales By Brand - September 2012
UK Auto Sales By Brand - October 2011
UK Auto Sales By Brand - August 2011
UK Auto Brand Market Share - August 2011
UK Auto Sales By Brand - July 2011
Top 10 Best-Selling Cars In The UK - September 2011
Canada Auto Sales By Brand - September 2011
U.S. Auto Sales By Brand - September 2011
- Domestics Vs. Imports - U.s. Auto Market Share Through Three Quarters Of 2012
American Auto Brands Market Share Click Any Chart For A Larger ViewPie charts: an essential ingredient in any recipe for successful sales analysis. Today we're looking at the U.S. auto industry in the first three quarters of 2012. How does the volume...
- Uk Auto Sales By Brand - October 2011
Britain's new car market grew 2.6% in October 2011 despite the efforts of 25 brands to pull the market down. Apart from the disappearance of Cadillac, Daihatsu, and Dodge (which combined for 24 sales last October) no decline was worse than the year-over-year...
- Luxury Auto Brand Market Share In Canada - September 2011
Between the three of them, Canada's trio of best-selling luxury brands accounted for 54.4% of all premium vehicle sales in September 2011. Audi, with 12.9% of the market, was up by half a percentage point. BMW, at 21.9%, was up more than a full percentage...
- U.s. Auto Brand Market Share Chart - September 2011
The Ford Motor Company and General Motors were both able to grow their market share from August to September. Though the gains may've been slim, the increase from 16.3% to 16.6% for Ford and 19.7% to 20.4% for General Motors is still better than what...
- New Vehicle Market Share By Brand In The Uk - August 2011
Ford improved its UK market share by half a percentage point from July to August as year-over-year sales at UK Blue Oval stores jumped 18%. General Motors, via Vauxhall and Chevrolet, saw market share slide half a percentage point over the summer. Collectively,...
Cars
UK Auto Sales By Brand - September 2011
Year-over-year, however, Ford was down 6.6%. And as you'll see in the pie chart at the bottom of this post, Ford may be the most popular individual brand but still loses out in market share terms to the massive Volkswagen Group.
Volkswagen, including its subsidiaries and Porsche partner, saw its market share fall from 21.9% in August to 18.8% in September 2011. Sales of the Volkswagen brand were up 18.4%, year-over-year. Audi reported a 17% improvement. Skoda was up 27.2%, SEAT was up 22.9%, Porsche jumped 52.6%, and little ol' Bentley was down 4.3%, or six units. During a month in which 51% of brands reported declining volume compared with September 2010, only 16% of the Volkswagen Group's brands did so. Audi was the UK's best-selling premium brand in September and leads BMW by 1597 sales through the first three-quarters of 2011.
We could spend time considering how much Honda struggles in the United Kingdom - quake-related inventory issues have caused problems for Honda all over the world - or how strange it is to see Chevrolet ranked 25th. We North Americans are accustomed to seeing Chevrolet battling for top spot. Instead, let's analyze the relative power of British brands. Or brands which were once British owned.
For the sake of sticking to automakers we're acquainted with as niche brands, let's exclude Vauxhall. Combined sales at Mini, Land Rover, Jaguar, Aston Martin, Bentley, MG, Lotus, and brands the SMMT refers to as "Other British" totalled 19,703 in September. That's 5.9% of the UK new vehicle market, a figure Hyundai/Kia can better. However, those same British brands only owned just 0.77% of the U.S. new vehicle market. The Union Jack still inspires some automotive loyalty.
The September 2011 table listing all automobile brands competing for sales in the United Kingdom is below. Scroll down a little more for the market share chart.
Rank | Automaker | September 2011 | % Change | Year To Date | YTD % Change |
#1 | Ford | 43,350 | -6.6 | 214,628 | -6.9 |
#2 | Vauxhall | 37,472 | -11.3 | 188,113 | -5.3 |
#3 | Volkswagen | 29,250 | +18.4 | 143,459 | +3.8 |
#4 | Audi | 18,588 | +17.0 | 92,324 | +13.0 |
#5 | Nissan | 18,573 | +17.8 | 77,184 | +8.4 |
#6 | BMW | 18,184 | -2.6 | 90,727 | +10.6 |
#7 | Peugeot | 16,902 | -7.7 | 77,900 | -12.7 |
#8 | Mercedes-Benz | 15,282 | +5.9 | 65,071 | +9.9 |
#9 | Toyota | 13,019 | -11.1 | 58,118 | -19.2 |
#10 | Hyundai | 11,562 | +37.1 | 49,091 | -5.3 |
#11 | Citroen | 11,538 | -10.3 | 54,967 | -7.2 |
#12 | Renault | 11,245 | -21.0 | 53,341 | -29.6 |
#13 | Kia | 9729 | +17.8 | 43,253 | -9.0 |
#14 | Honda | 9690 | -20.4 | 39,564 | -24.3 |
#15 | Mini | 9690 | +28.1 | 38,147 | +16.2 |
#16 | Mazda | 7108 | -17.5 | 27,070 | -28.4 |
#17 | Fiat | 7025 | -25.0 | 34,192 | -22.0 |
#18 | Skoda | 6950 | +27.2 | 36,297 | +11.6 |
#19 | SEAT | 6612 | +22.9 | 28,862 | +10.4 |
#20 | Land Rover | 6230 | +7.6 | 28,684 | -6.8 |
#21 | Volvo | 5443 | +9.6 | 26,115 | -12.7 |
#22 | Suzuki | 4550 | -0.2 | 16,951 | -4.2 |
#23 | Jaguar | 3295 | +12.5 | 11,337 | -13.7 |
#24 | Alfa Romeo | 1964 | +25.0 | 9480 | +55.3 |
#25 | Chevrolet | 1644 | -27.7 | 10,073 | -10.3 |
#26 | Lexus | 1601 | +31.2 | 6162 | +15.7 |
#27 | Mitsubishi | 1594 | -40.8 | 8383 | -14.6 |
#28 | Porsche | 943 | +52.6 | 4596 | -7.5 |
#29 | smart | 766 | -45.5 | 4029 | -36.6 |
#30 | Subaru | 573 | -11.6 | 2174 | -29.4 |
#31 | Jeep | 442 | +15.4 | 1669 | +3.4 |
#32 | Chrysler | 354 | +22.5 | 798 | -32.6 |
#33 | Saab | 272 | -77.6 | 4046 | -3.1 |
#34 | Abarth | 267 | +9.4 | 1085 | -6.0 |
#35 | Aston Martin | 142 | +14.5 | 852 | +0.8 |
#36 | Bentley | 135 | -4.3 | 851 | +5.6 |
#37 | Perodua | 71 | -28.3 | 449 | -29.8 |
#38 | MG | 43 | +34.4 | 227 | -9.2 |
#39 | Proton | 42 | -52.8 | 375 | -41.3 |
#40 | Maserati | 41 | -37.9 | 311 | -18.8 |
#41 | Infiniti | 22 | -15.4 | 224 | +85.1 |
#42 | Ssangyong | 21 | +50.0 | 32 | -85.5 |
#43 | Lotus | 5 | -82.8 | 277 | -28.4 |
 |
| CLICK CHART FOR LARGER VIEW |
Related From GoodCarBadCar.net
United Kingdom Auto Sales By Brand - September 2012
UK Auto Sales By Brand - October 2011
UK Auto Sales By Brand - August 2011
UK Auto Brand Market Share - August 2011
UK Auto Sales By Brand - July 2011
Top 10 Best-Selling Cars In The UK - September 2011
Canada Auto Sales By Brand - September 2011
U.S. Auto Sales By Brand - September 2011
- Domestics Vs. Imports - U.s. Auto Market Share Through Three Quarters Of 2012
American Auto Brands Market Share Click Any Chart For A Larger ViewPie charts: an essential ingredient in any recipe for successful sales analysis. Today we're looking at the U.S. auto industry in the first three quarters of 2012. How does the volume...
- Uk Auto Sales By Brand - October 2011
Britain's new car market grew 2.6% in October 2011 despite the efforts of 25 brands to pull the market down. Apart from the disappearance of Cadillac, Daihatsu, and Dodge (which combined for 24 sales last October) no decline was worse than the year-over-year...
- Luxury Auto Brand Market Share In Canada - September 2011
Between the three of them, Canada's trio of best-selling luxury brands accounted for 54.4% of all premium vehicle sales in September 2011. Audi, with 12.9% of the market, was up by half a percentage point. BMW, at 21.9%, was up more than a full percentage...
- U.s. Auto Brand Market Share Chart - September 2011
The Ford Motor Company and General Motors were both able to grow their market share from August to September. Though the gains may've been slim, the increase from 16.3% to 16.6% for Ford and 19.7% to 20.4% for General Motors is still better than what...
- New Vehicle Market Share By Brand In The Uk - August 2011
Ford improved its UK market share by half a percentage point from July to August as year-over-year sales at UK Blue Oval stores jumped 18%. General Motors, via Vauxhall and Chevrolet, saw market share slide half a percentage point over the summer. Collectively,...