Cars
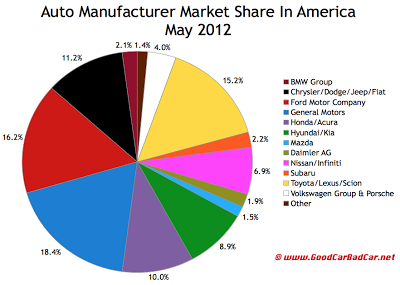
45.8% of the 1,334,642 new vehicles sold in the United States in May 2012 were Ford Motor Company, Chrysler Group, or General Motors products. That's up from the 45.1% achieved by these three auto manufacturers in April but down from the 49.7% Detroit enjoyed in May 2011 when the biggest Japanese automakers were having terrible earthquake and tsunami-inflicted supply issues.
Given Detroit's year-over-year decline, it's not surprising to see huge year-over-year market share increases from Toyota and Honda. Toyota was up five percentage points from May 2011; Honda moved up 1.5 percentage points. Like General Motors, Ford, and Chrysler, Hyundai-Kia also fell back from May 2011's strong 10.1% market share. Nissan did, as well.
There's good news all around, however. Nearly every auto brand with cars on sale in the United States sold a significantly greater number of cars this May than last. Only Cadillac, Lincoln, Volvo, Mitsubishi, and Bentley posted year-over-year volume declines. FoMoCo, which saw its market share slide from 18% in May 2011 to 16.2% in May 2012, actually sold 24,170 more vehicles than at this time last year. General Motors lost more than two percentage points of market share yet sold 24,064 more new vehicles.
Chrysler, Dodge, Ram, Jeep, and Fiat combined to sell 34,678 more new vehicles this May than last. Indeed, Chrysler Group market share was on the rise, from 10.9% in May 2011 to 11.2% in May 2012. Chrysler market share fell from April's 11.9%, however.
You can see each and every brand on sale in America ranked by total volume here. Historical monthly and yearly sales figures for individual models can always be accessed through the dropdown at the top right of this page or at GoodCarBadCar's Sales Stats home. America's 20 best-selling vehicles accounted for 40.3% of the market.
Related From GoodCarBadCar.net
June 2012 U.S. ASBB & Market Share Charts
U.S. Auto Brand Market Share - April 2012
U.S. Auto Brand Market Share - May 2011
Top 30 Best-Selling Vehicles In America - May 2012
U.S. Auto Sales By Brand - May 2012
U.S. Luxury Auto Brand Market Share - May 2012
- Canada Auto Brand Market Share - March 2012
Canadians acquired nearly 158,000 new vehicles in March 2012. Compared with January and February, the new vehicle market is a whole different ball game once spring has sprung. March sales accounted for 44% of all Q1 sales this year (and 46% of Q1 sales...
- U.s. Auto Brand Market Share - March 2012
In February, America's three automobile manufacturers, including Fiat-run Chrysler, combined to own 45.3% of the new vehicle market in the United States. In March, that figure fell to 43.9%, but that's not because of any losses at Ford Motor Company,...
- New Vehicle Market Share By Brand In America - June 2011
Ford was America's best-selling brand but Ford Motor Company's overall market share in the United States was 18.4% in June 2011, two points down from General Motors. Next up was the Chrysler Group, including Fiat, with 11.4%. It was GM, however,...
- New Vehicle Market Share By Brand In Canada - May 2011
149,034 new vehicles were sold in Canada in May 2011. Only 46.6% of those sales were passenger cars. General Motors, Ford Motor Company, and the Chrysler Group (excluding Fiat) found 72,041 buyers, the majority of sales came about in dealerships which...
- New Vehicle Market Share By Brand In America - April 2011
General Motors clawed back significant market share in the United States one month after a March in which the company's portion of new vehicle sales had dropped below Ford Motor Company's share. With one-fifth of all new vehicle sales in...
Cars
U.S. Auto Brand Market Share - May 2012
 |
| Cadillac's U.S. Market Share Fell From 0.8% In April To 0.7% In May |
Given Detroit's year-over-year decline, it's not surprising to see huge year-over-year market share increases from Toyota and Honda. Toyota was up five percentage points from May 2011; Honda moved up 1.5 percentage points. Like General Motors, Ford, and Chrysler, Hyundai-Kia also fell back from May 2011's strong 10.1% market share. Nissan did, as well.
There's good news all around, however. Nearly every auto brand with cars on sale in the United States sold a significantly greater number of cars this May than last. Only Cadillac, Lincoln, Volvo, Mitsubishi, and Bentley posted year-over-year volume declines. FoMoCo, which saw its market share slide from 18% in May 2011 to 16.2% in May 2012, actually sold 24,170 more vehicles than at this time last year. General Motors lost more than two percentage points of market share yet sold 24,064 more new vehicles.
Chrysler, Dodge, Ram, Jeep, and Fiat combined to sell 34,678 more new vehicles this May than last. Indeed, Chrysler Group market share was on the rise, from 10.9% in May 2011 to 11.2% in May 2012. Chrysler market share fell from April's 11.9%, however.
You can see each and every brand on sale in America ranked by total volume here. Historical monthly and yearly sales figures for individual models can always be accessed through the dropdown at the top right of this page or at GoodCarBadCar's Sales Stats home. America's 20 best-selling vehicles accounted for 40.3% of the market.
 |
| Click Chart For Larger View |
Related From GoodCarBadCar.net
June 2012 U.S. ASBB & Market Share Charts
U.S. Auto Brand Market Share - April 2012
U.S. Auto Brand Market Share - May 2011
Top 30 Best-Selling Vehicles In America - May 2012
U.S. Auto Sales By Brand - May 2012
U.S. Luxury Auto Brand Market Share - May 2012
- Canada Auto Brand Market Share - March 2012
Canadians acquired nearly 158,000 new vehicles in March 2012. Compared with January and February, the new vehicle market is a whole different ball game once spring has sprung. March sales accounted for 44% of all Q1 sales this year (and 46% of Q1 sales...
- U.s. Auto Brand Market Share - March 2012
In February, America's three automobile manufacturers, including Fiat-run Chrysler, combined to own 45.3% of the new vehicle market in the United States. In March, that figure fell to 43.9%, but that's not because of any losses at Ford Motor Company,...
- New Vehicle Market Share By Brand In America - June 2011
Ford was America's best-selling brand but Ford Motor Company's overall market share in the United States was 18.4% in June 2011, two points down from General Motors. Next up was the Chrysler Group, including Fiat, with 11.4%. It was GM, however,...
- New Vehicle Market Share By Brand In Canada - May 2011
149,034 new vehicles were sold in Canada in May 2011. Only 46.6% of those sales were passenger cars. General Motors, Ford Motor Company, and the Chrysler Group (excluding Fiat) found 72,041 buyers, the majority of sales came about in dealerships which...
- New Vehicle Market Share By Brand In America - April 2011
General Motors clawed back significant market share in the United States one month after a March in which the company's portion of new vehicle sales had dropped below Ford Motor Company's share. With one-fifth of all new vehicle sales in...
