Cars
 Can a conventional compact hatchback and a Mazda-derived subcompact sedan save Toyota's Scion brand?
U.S. sales in September 2015 were certainly much healthier than at this stage a year ago, one year before the iM and iA arrived. The brand posted a 57% year-over-year improvement in September, the greatest year-over-year percentage increase of any car brand in America. (Only Land Rover, an SUV-only brand, grew faster.)
U.S. Car Sales Rankings By Model - August 2015 YTD
U.S. Car Sales Rankings By Model - September 2014 YTD
Scion sold 2035 copies of the iA sedan in the model's first month of availability plus another 1353 iM hatchbacks. Scion also hasn't run out of xBs to sell, either, as that model was down just 6% to 1117. Along with 778 FR-S sports cars, a handful of iQs and xDs, and 1208 tC sales, Scion sold 6510 cars in America in September 2015, the best month for the brand since September 2012, the last time a new model arrived to assumptions that it, the FR-S, was going to rescue Scion.
Scion, of course, is hardly the stuff of mainstream conversations, far less so than in the past, too. Only 1% of the new passenger cars sold in America in September 2015 were Scions. Its Toyota parent company sold five times more Camrys than Scions last month, four times more Corollas, and nearly twice as many Lexus cars.
Top 13 Best-Selling Pickup Trucks In America - September 2015 YTD
Commercial Van Sales In America - September 2015 YTD
Minivan Sales In America - September 2015 YTD
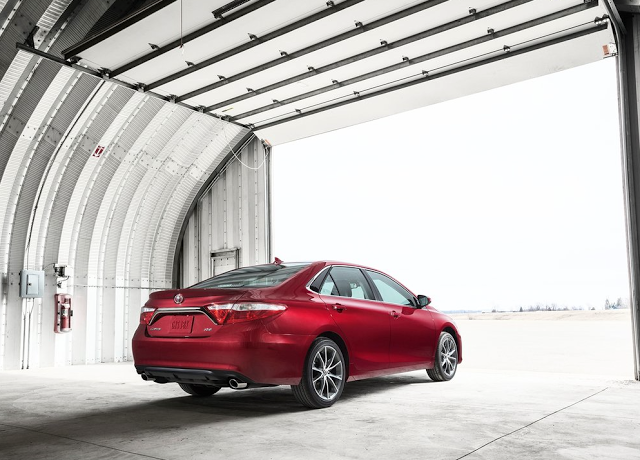
The Camry, meanwhile, continues to be America's top-selling passenger car and America's fourth-best-selling vehicle line overall. While year-to-date volume through the first three quarters of 2015 is down 3%, the Camry surged along with many of its rivals in the booming month of September, which featured an extra selling day (compared with September 2014) and included the high-volume Labour Day weekend's activity, which the September 2014 tally did not.
All seven of America's seven best-selling cars recorded year-over-year increases in September 2015 – only three of those cars have posted growth through the first nine months of 2015.
U.S. Auto Sales Brand Rankings - September 2015 YTD
U.S. Vehicle Sales Rankings By Model - September 2015 YTD
U.S. SUV/Crossover Sales Rankings By Model - September 2015 YTD
Reminder: these are year-to-date rankings, but you can sort cars by September volume by clicking the September 2015 column header, or you can rank cars by improvements or declines using the % columns. Or, most importantly, you can list automakers together by selecting the Car column header.
As always, you can find historical monthly and yearly sales figures for any of these vehicles by selecting a make and model at GCBC's Sales Stats page.
Click Column Headers To Sort • August 2015 • September 2014
Source: Automakers & ANDC
* Italicized, asterisked, unranked lines are nothing more than available breakdowns, already included in the model's total, not in addition to the model's total.
² Total Prius Family sales: up 13% to 16,110 in September; down 14% to 141,940 YTD.
³ BMW has traditionally chosen to include sales of the 4-Series within figures for the 3-Series, presumably for year-over-year consistency's sake, while also combining the 1-Series and 2-Series. Now, since July, we have a 3-Series/4-Series breakdown. (Hyundai does the same with the Genesis and Genesis Coupe.)
Total 3-Series/4-Series sales: down 7% to 11,871 in September; up 9% to 103,582 YTD.
Sales data for brands such as Aston Martin, Ferrari, Lamborghini, Lotus, Rolls-Royce etc. are unfortunately not broken down by model. ANDC estimates say sales for Aston Martin and Lotus in the first nine months of 2015 were 765 and 113, respectively. The Wall Street Journal reports 1709 year-to-date Ferrari sales, 801 Lamborghini sales, and 636 Rolls-Royce sales. Tesla, unfortunately, doesn't release model-specific monthly U.S. sales data, but Automotive News now issues estimates for the brand, and those estimates say Tesla sold 1700 cars in September; 15,300 YTD. HybridCars.com estimates 2400 August Model S sales; 17,700 YTD, along with the first 6 copies of the Model X.
- Large Luxury Car Sales In Canada - September 2015 Ytd
In Mercedes-Benz Canada's best-ever September, Canadian sales of the S-Class more than doubled to 148 units, more than double the total achieved by any of its competitors. Canada Vehicle Sales Rankings By Model - September 2015 YTD Canada Car Sales...
- Large Luxury Car Sales In America - September 2015 Ytd
Although sales in its category continue to decline even during a spectacular month for the overall U.S. auto industry, the class-leading Mercedes-Benz S-Class posted a 2.5% increase to nearly 2000 sales in September 2015. U.S. Vehicle Sales Rankings By...
- Top 20 Best-selling Cars In America - September 2015
Having built up a 47,588-unit lead through the first three quarters of 2015, the Toyota Camry is securely ensconced in its position as America's best-selling car and will not surrender that title at year's end. The Camry began its current...
- July 2015 Ytd U.s. Passenger Car Sales Rankings - Top 155 Best-selling Cars In America - Every Car Ranked
Three of the five best-selling cars in America - along with four of the top six, nine of the top 15, 13 of the top 20 – posted declining year-over-year volume through the first seven months of 2015. Is it any wonder that car sales slid more than...
- September 2014 U.s. Passenger Car Sales Rankings - Top 155 Best-selling Cars In America - Every Car Ranked
Honda Accord sales in the United States accelerated at a rapid rate for the second consecutive month, enabling Honda to knock off the Toyota Camry as America's best-selling car in September 2014. Through the first nine months of 2014, the Camry...
Cars
September 2015 YTD U.S. Passenger Car Sales Rankings - Top 158 Best-Selling Cars In America - Every Car Ranked
U.S. sales in September 2015 were certainly much healthier than at this stage a year ago, one year before the iM and iA arrived. The brand posted a 57% year-over-year improvement in September, the greatest year-over-year percentage increase of any car brand in America. (Only Land Rover, an SUV-only brand, grew faster.)
U.S. Car Sales Rankings By Model - August 2015 YTD
U.S. Car Sales Rankings By Model - September 2014 YTD
Scion sold 2035 copies of the iA sedan in the model's first month of availability plus another 1353 iM hatchbacks. Scion also hasn't run out of xBs to sell, either, as that model was down just 6% to 1117. Along with 778 FR-S sports cars, a handful of iQs and xDs, and 1208 tC sales, Scion sold 6510 cars in America in September 2015, the best month for the brand since September 2012, the last time a new model arrived to assumptions that it, the FR-S, was going to rescue Scion.
Scion, of course, is hardly the stuff of mainstream conversations, far less so than in the past, too. Only 1% of the new passenger cars sold in America in September 2015 were Scions. Its Toyota parent company sold five times more Camrys than Scions last month, four times more Corollas, and nearly twice as many Lexus cars.
Top 13 Best-Selling Pickup Trucks In America - September 2015 YTD
Commercial Van Sales In America - September 2015 YTD
Minivan Sales In America - September 2015 YTD
The Camry, meanwhile, continues to be America's top-selling passenger car and America's fourth-best-selling vehicle line overall. While year-to-date volume through the first three quarters of 2015 is down 3%, the Camry surged along with many of its rivals in the booming month of September, which featured an extra selling day (compared with September 2014) and included the high-volume Labour Day weekend's activity, which the September 2014 tally did not.
All seven of America's seven best-selling cars recorded year-over-year increases in September 2015 – only three of those cars have posted growth through the first nine months of 2015.
U.S. Auto Sales Brand Rankings - September 2015 YTD
U.S. Vehicle Sales Rankings By Model - September 2015 YTD
U.S. SUV/Crossover Sales Rankings By Model - September 2015 YTD
Reminder: these are year-to-date rankings, but you can sort cars by September volume by clicking the September 2015 column header, or you can rank cars by improvements or declines using the % columns. Or, most importantly, you can list automakers together by selecting the Car column header.
As always, you can find historical monthly and yearly sales figures for any of these vehicles by selecting a make and model at GCBC's Sales Stats page.
Rank | Car | September 2015 YTD | September 2014 YTD | % Change | September 2015 | September 2014 | % Change |
|---|---|---|---|---|---|---|---|
| #1 | Toyota Camry | 326,330 | 334,978 | -2.6% | 34,487 | 28,507 | 21.0% |
| #2 | Toyota Corolla | 278,742 | 258,805 | 7.7% | 26,636 | 20,530 | 29.7% |
| #3 | Honda Accord | 264,814 | 304,382 | -13.0% | 33,641 | 32,956 | 2.1% |
| #4 | Nissan Altima | 262,424 | 256,935 | 2.1% | 24,224 | 21,675 | 11.8% |
| #5 | Honda Civic | 249,749 | 253,430 | -1.5% | 28,278 | 22,263 | 27.0% |
| #6 | Ford Fusion | 231,475 | 240,585 | -3.8% | 24,942 | 21,693 | 15.0% |
| #7 | Hyundai Elantra | 193,962 | 176,403 | 10.0% | 20,724 | 18,848 | 10.0% |
| #8 | Chevrolet Cruze | 177,970 | 208,114 | -14.5% | 14,032 | 18,415 | -23.8% |
| #9 | Ford Focus | 163,864 | 176,156 | -7.0% | 13,437 | 15,397 | -12.7% |
| #10 | Hyundai Sonata | 157,680 | 164,934 | -4.4% | 16,124 | 14,918 | 8.1% |
| #11 | Nissan Sentra | 154,270 | 141,216 | 9.2% | 14,196 | 12,557 | 13.1% |
| #12 | Chevrolet Malibu | 147,161 | 148,574 | -1.0% | 17,066 | 15,186 | 12.4% |
| #13 | Chrysler 200 | 147,073 | 75,142 | 95.7% | 11,364 | 10,995 | 3.4% |
| #14 | Kia Optima | 118,301 | 122,646 | -3.5% | 11,719 | 10,908 | 7.4% |
| #15 | Kia Soul | 112,683 | 115,579 | -2.5% | 13,614 | 10,802 | 26.0% |
| #16 | Nissan Versa | 109,832 | 110,272 | -0.4% | 18,053 | 12,072 | 49.5% |
| #17 | Subaru Outback | 108,419 | 97,266 | 11.5% | 15,126 | 11,315 | 33.7% |
| #18 | Volkswagen Jetta | 97,465 | 115,055 | -15.3% | 7,773 | 10,245 | -24.1% |
| #18.1 | Volkswagen Jetta Sedan * | 94,793 | 99,142 | -4.4% | 7,746 | 8,980 | -13.7% |
| #18.2 | Volkswagen Jetta SportWagen * | 2,672 | 15,913 | -83.2% | 27 | 1,265 | -97.9% |
| #19 | Ford Mustang | 96,225 | 59,831 | 60.8% | 9,456 | 3,158 | 199% |
| #20 | Toyota Prius ² | 89,812 | 110,455 | -18.7% | 10,168 | 8,339 | 21.9% |
| #20.1 | Toyota Prius Liftback * | 85,778 | 98,613 | -13.0% | 9,952 | 7,986 | 24.6% |
| #20.2 | Toyota Prius Plug-In * | 4,034 | 11,842 | -65.9% | 216 | 353 | -38.8% |
| #21 | Chevrolet Impala | 85,466 | 107,162 | -20.2% | 9,359 | 9,225 | 1.5% |
| #22 | Mazda 3 | 82,300 | 80,259 | 2.5% | 7,757 | 7,859 | -1.3% |
| #23 | Subaru Impreza | 75,613 | 64,329 | 17.5% | 8,588 | 5,210 | 64.8% |
| #23.1 | Subaru Impreza * | 50,462 | 46,445 | 8.7% | 5,555 | 4,040 | 37.5% |
| #23.2 | Subaru Impreza WRX/STI * | 25,151 | 17,884 | 40.6% | 3,033 | 1,170 | 159% |
| #24 | Dodge Charger | 70,700 | 72,141 | -2.0% | 7,384 | 8,624 | -14.4% |
| #25 | BMW 3-Series ³ | 69,820 | 66,777 | 4.6% | 9,145 | 8,270 | 10.6% |
| #26 | Dodge Dart | 68,319 | 60,763 | 12.4% | 7,244 | 6,923 | 4.6% |
| #27 | Subaru XV Crosstrek | 66,738 | 54,303 | 22.9% | 7,414 | 5,691 | 30.3% |
| #28 | Mercedes-Benz C-Class | 64,535 | 50,170 | 28.6% | 7,660 | 6,285 | 21.9% |
| #29 | Volkswagen Passat | 63,736 | 74,913 | -14.9% | 7,228 | 7,280 | -0.7% |
| #30 | Kia Forte | 63,300 | 53,793 | 17.7% | 5,388 | 4,517 | 19.3% |
| #31 | Chevrolet Camaro | 61,544 | 69,878 | -11.9% | 5,246 | 5,111 | 2.6% |
| #32 | Ford Fiesta | 53,868 | 52,403 | 2.8% | 6,996 | 4,185 | 67.2% |
| #33 | Dodge Challenger | 51,949 | 38,376 | 35.4% | 4,552 | 3,619 | 25.8% |
| #34 | Chevrolet Sonic | 50,535 | 77,947 | -35.2% | 3,780 | 8,328 | -54.6% |
| #35 | Volkswagen Golf | 49,767 | 21,201 | 135% | 5,251 | 3,487 | 50.6% |
| #35.1 | Volkswagen Golf GTI * | 16,817 | 12,124 | 38.7% | 1,825 | 1,600 | 14.1% |
| #35.2 | Volkswagen Golf * | 16,193 | 9,062 | 78.7% | 1,193 | 1,887 | -36.8% |
| #35.3 | Volkswagen Golf SportWagen * | 11,501 | --- | --- | 1,428 | --- | --- |
| #35.4 | Volkswagen Golf R * | 2,701 | 15 | 17,907% | 462 | --- | --- |
| #35.5 | Volkswagen e-Golf * | 2,555 | --- | --- | 343 | --- | --- |
| #36 | Hyundai Accent | 48,625 | 46,405 | 4.8% | 3,640 | 3,662 | -0.6% |
| #37 | Mazda 6 | 47,072 | 41,855 | 12.5% | 4,528 | 4,263 | 6.2% |
| #38 | Lexus ES | 46,962 | 52,910 | -11.2% | 5,195 | 5,722 | -9.2% |
| #39 | Toyota Avalon | 44,318 | 50,025 | -11.4% | 4,828 | 4,862 | -0.7% |
| #40 | Subaru Legacy | 44,231 | 34,718 | 27.4% | 6,277 | 6,198 | 1.3% |
| #41 | Honda Fit | 44,146 | 39,618 | 11.4% | 1,279 | 6,628 | -80.7% |
| #42 | Chrysler 300 | 39,757 | 39,584 | 0.4% | 6,723 | 4,757 | 41.3% |
| #43 | Ford Taurus | 37,959 | 51,694 | -26.6% | 3,942 | 4,757 | -17.1% |
| #43.1 | Ford Taurus * | 30,513 | 43,582 | -30.0% | 3,028 | 3,893 | -22.2% |
| #43.2 | Ford Taurus Police Interceptor * | 7,446 | 8,112 | -8.2% | 914 | 864 | 5.8% |
| #44 | Lexus IS | 35,389 | 37,038 | -4.5% | 3,152 | 3,611 | -12.7% |
| #45 | Mercedes-Benz E-Class | 35,325 | 52,609 | -32.9% | 4,173 | 4,884 | -14.6% |
| #46 | Acura TLX | 34,808 | 6,170 | 464% | 4,753 | 3,884 | 22.4% |
| #47 | BMW 5-Series | 33,838 | 39,168 | -13.6% | 4,059 | 1,407 | 188% |
| #48 | BMW 4-Series ³ | 33,762 | 27,934 | 20.9% | 2,726 | 4,544 | -40.0% |
| #49 | Buick LaCrosse | 32,549 | 37,280 | -12.7% | 3,880 | 3,626 | 7.0% |
| #50 | Infiniti Q50 | 31,603 | 25,864 | 22.2% | 3,557 | 2,742 | 29.7% |
| #51 | Mini Cooper | 31,598 | 20,565 | 53.6% | 3,132 | 2,116 | 48.0% |
| #51.1 | Mini Cooper 2-Door * | 15,984 | 13,052 | 22.5% | 1,685 | 1,118 | 50.7% |
| #51.2 | Mini Cooper 4-Door * | 11,599 | --- | --- | 1,174 | --- | --- |
| #51.3 | Mini Cooper Convertible * | 2,446 | 2,875 | -14.9% | 238 | 416 | -42.8% |
| #51.4 | Mini Cooper Roadster * | 1,094 | 1,202 | -9.0% | 20 | 205 | -90.2% |
| #51.5 | Mini Cooper Coupe * | 452 | 847 | -46.6% | 14 | 157 | -91.1% |
| #51.6 | Mini Cooper Clubman * | 23 | 2,589 | -99.1% | 1 | 220 | -99.5% |
| #52 | Toyota Prius C ² | 29,649 | 31,564 | -6.1% | 3,367 | 3,192 | 5.5% |
| #53 | Chevrolet Spark | 27,839 | 30,937 | -10.0% | 2,371 | 2,027 | 17.0% |
| #54 | Audi A3 | 26,972 | 14,669 | 83.9% | 2,712 | 2,340 | 15.9% |
| #55 | Nissan Maxima | 26,801 | 39,749 | -32.6% | 3,871 | 4,398 | -12.0% |
| #56 | Chevrolet Corvette | 26,398 | 25,950 | 1.7% | 2,572 | 2,467 | 4.3% |
| #57 | Buick Verano | 25,002 | 34,327 | -27.2% | 2,377 | 3,913 | -39.3% |
| #58 | Hyundai Genesis ³ | 24,423 | 22,313 | 9.5% | 2,239 | 2,248 | -0.4% |
| #59 | Mercedes-Benz CLA-Class | 23,253 | 18,207 | 27.7% | 2,089 | 2,531 | -17.5% |
| #60 | Lincoln MKZ | 22,963 | 26,769 | -14.2% | 2,490 | 2,176 | 14.4% |
| #61 | Audi A4 | 22,530 | 29,304 | -23.1% | 2,482 | 2,994 | -17.1% |
| #61.1 | Audi A4 Sedan * | 20,527 | 25,829 | -20.5% | 2,221 | 2,480 | -10.4% |
| #61.2 | Audi A4 Allroad * | 2,003 | 3,475 | -42.4% | 261 | 514 | -49.2% |
| #62 | Toyota Prius V ² | 22,479 | 23,471 | -4.2% | 2,575 | 2,746 | -6.2% |
| #63 | Fiat 500 | 21,329 | 26,616 | -19.9% | 1,926 | 2,737 | -29.6% |
| #64 | Kia Rio | 20,276 | 29,387 | -31.0% | 1,480 | 2,240 | -33.9% |
| #65 | Toyota Venza | 19,157 | 23,445 | -18.3% | 1,584 | 1,858 | -14.7% |
| #66 | Volkswagen Beetle | 19,066 | 23,306 | -18.2% | 1,539 | 1,821 | -15.5% |
| #66.1 | Volkswagen Beetle Coupe * | 10,736 | 13,335 | -19.5% | 890 | 1,070 | -16.8% |
| #66.2 | Volkswagen Beetle Convertible * | 8,330 | 9,971 | -16.5% | 649 | 751 | -13.6% |
| #67 | Cadillac ATS | 18,839 | 22,535 | -16.4% | 2,295 | 2,239 | 2.5% |
| #68 | Mitsubishi Mirage | 17,971 | 12,866 | 39.7% | 1,348 | 1,340 | 0.6% |
| #69 | Hyundai Veloster | 17,655 | 22,965 | -23.1% | 2,118 | 2,777 | -23.7% |
| #70 | Ford C-Max | 17,291 | 21,731 | -20.4% | 1,966 | 1,786 | 10.1% |
| #71 | Audi A6 | 17,072 | 17,167 | -0.6% | 1,713 | 1,510 | 13.4% |
| #72 | Lexus GS | 16,233 | 16,252 | -0.1% | 1,595 | 1,592 | 0.2% |
| #73 | Cadillac XTS | 16,023 | 18,386 | -12.9% | 1,600 | 1,979 | -19.2% |
| #74 | Mercedes-Benz S-Class | 15,994 | 16,915 | -5.4% | 1,956 | 1,909 | 2.5% |
| #75 | Toyota Yaris | 15,535 | 10,339 | 50.3% | 586 | 598 | -2.0% |
| #76 | Mitsubishi Lancer | 14,270 | 12,094 | 18.0% | 1,116 | 971 | 14.9% |
| #77 | Cadillac CTS | 14,253 | 22,921 | -37.8% | 1,319 | 2,282 | -42.2% |
| #78 | Buick Regal | 14,106 | 16,803 | -16.1% | 1,728 | 1,366 | 26.5% |
| #79 | Nissan Leaf | 13,630 | 21,822 | -37.5% | 1,247 | 2,881 | -56.7% |
| #80 | Scion tC | 13,525 | 14,460 | -6.5% | 1,208 | 1,404 | -14.0% |
| #81 | Acura ILX | 13,358 | 12,854 | 3.9% | 1,614 | 1,464 | 10.2% |
| #82 | Volvo S60 | 12,548 | 16,447 | -23.7% | 1,265 | 1,763 | -28.2% |
| #83 | Scion xB | 12,501 | 12,444 | 0.5% | 1,117 | 1,190 | -6.1% |
| #84 | Lexus CT200h | 11,132 | 13,585 | -18.1% | 1,131 | 1,078 | 4.9% |
| #85 | Lexus RC | 10,458 | --- | --- | 1,159 | --- | --- |
| #86 | Audi A5 | 9,812 | 13,165 | -25.5% | 945 | 1,204 | -21.5% |
| #87 | Chevrolet Volt | 9,264 | 14,540 | -36.3% | 949 | 1,394 | -31.9% |
| #88 | Scion FR-S | 8,544 | 11,182 | -23.6% | 778 | 920 | -15.4% |
| #89 | Infiniti Q40 | 8,503 | 12,208 | -30.3% | 150 | 881 | -82.4% |
| #90 | BMW 2-Series (& 1-Series) ³ | 8,472 | 5,303 | 59.8% | 1,078 | 740 | 45.7% |
| #91 | BMW i3 | 7,893 | 3,104 | 154% | 1,710 | 1,022 | 67.3% |
| #92 | Porsche 911 | 7,557 | 7,758 | -2.6% | 768 | 726 | 5.8% |
| #93 | Honda Crosstour | 7,227 | 9,032 | -20.0% | 777 | 763 | 1.8% |
| #94 | Fiat 500L | 7,034 | 8,885 | -20.8% | 339 | 623 | -45.6% |
| #95 | BMW 7-Series | 6,363 | 6,264 | 1.6% | 134 | 480 | -72.1% |
| #96 | Infiniti Q70 | 6,304 | 3,377 | 86.7% | 622 | 206 | 202% |
| #97 | Mazda MX-5 Miata | 6,068 | 3,855 | 57.4% | 940 | 414 | 127% |
| #98 | BMW 6-Series | 5,918 | 6,369 | -7.1% | 265 | 450 | -41.1% |
| #99 | Nissan 370Z | 5,882 | 5,938 | -0.9% | 573 | 497 | 15.3% |
| #100 | Audi A7 | 5,508 | 6,386 | -13.7% | 626 | 588 | 6.5% |
| #101 | Smart Fortwo | 5,432 | 8,080 | -32.8% | 750 | 748 | 0.3% |
| #102 | Lincoln MKS | 5,428 | 6,260 | -13.3% | 503 | 457 | 10.1% |
| #103 | Lexus LS | 5,270 | 5,904 | -10.7% | 406 | 568 | -28.5% |
| #104 | Kia Cadenza | 4,880 | 7,629 | -36.0% | 859 | 1,105 | -22.3% |
| #105 | Jaguar XF | 4,647 | 4,225 | 10.0% | 266 | 258 | 3.1% |
| #106 | Hyundai Azera | 4,639 | 5,976 | -22.4% | 281 | 762 | -63.1% |
| #107 | Mercedes-Benz CLS-Class | 4,616 | 6,149 | -24.9% | 299 | 1,100 | -72.8% |
| #108 | Volkswagen CC | 4,490 | 8,157 | -45.0% | 384 | 627 | -38.8% |
| #109 | Subaru BRZ | 4,133 | 6,245 | -33.8% | 301 | 506 | -40.5% |
| #110 | Volvo XC70 | 3,960 | 3,748 | 5.7% | 463 | 559 | -17.2% |
| #111 | Porsche Panamera | 3,885 | 4,394 | -11.6% | 557 | 450 | 23.8% |
| #112 | Audi A8 | 3,817 | 4,060 | -6.0% | 441 | 487 | -9.4% |
| #113 | Jaguar F-Type | 3,367 | 2,945 | 14.3% | 354 | 329 | 7.6% |
| #114 | Volvo V60 | 3,329 | 3,993 | -16.6% | 172 | 383 | -55.1% |
| #115 | Infiniti Q60 | 3,180 | 5,758 | -44.8% | 258 | 454 | -43.2% |
| #116 | Mercedes-Benz SLK-Class | 3,137 | 3,595 | -12.7% | 339 | 489 | -30.7% |
| #117 | Mercedes-Benz SL-Class | 3,132 | 3,758 | -16.7% | 259 | 584 | -55.7% |
| #118 | Jaguar XJ | 2,920 | 3,468 | -15.8% | 357 | 456 | -21.7% |
| #119 | Porsche Cayman | 2,730 | 2,568 | 6.3% | 315 | 245 | 28.6% |
| #120 | Chevrolet SS | 2,421 | 2,166 | 11.8% | 222 | 111 | 100% |
| #121 | Porsche Boxster | 2,379 | 3,024 | -21.3% | 297 | 275 | 8.0% |
| #122 | Honda CR-Z | 2,205 | 2,945 | -25.1% | 310 | 248 | 25.0% |
| #123 | Volkswagen Eos | 2,156 | 2,819 | -23.5% | 356 | 216 | 64.8% |
| #124 | Scion iA | 2,035 | --- | --- | 2,035 | --- | --- |
| #125 | Kia K900 | 1,905 | 1,106 | 72.2% | 329 | 56 | 488% |
| #126 | Volvo V60 Cross Country | 1,900 | --- | --- | 134 | --- | --- |
| #127 | Acura RLX | 1,774 | 2,695 | -34.2% | 174 | 187 | -7.0% |
| #128 | Hyundai Equus | 1,730 | 2,596 | -33.4% | 212 | 261 | -18.8% |
| #129 | Mercedes-Benz B-Class | 1,687 | 159 | 961% | 147 | 65 | 126% |
| #130 | BMW Z4 | 1,409 | 1,617 | -12.9% | 96 | 170 | -43.5% |
| #131 | Honda Insight | 1,353 | 3,154 | -57.1% | 64 | 240 | -73.3% |
| #132 | Scion iM | 1,353 | --- | --- | 1,353 | --- | --- |
| #133 | BMW i8 | 1,342 | 67 | 1,903% | 182 | 58 | 214% |
| #134 | Chevrolet Caprice PPV | 1,274 | 2,850 | -55.3% | 155 | 334 | -53.6% |
| #135 | Dodge Avenger | 1,156 | 49,363 | -97.7% | 32 | 1,677 | -98.1% |
| #136 | Volvo S80 | 1,083 | 1,393 | -22.3% | 65 | 182 | -64.3% |
| #137 | Nissan GT-R | 929 | 1,018 | -8.7% | 38 | 159 | -76.1% |
| #138 | Nissan Cube | 912 | 3,203 | -71.5% | 24 | 238 | -89.9% |
| #139 | Mercedes-AMG GT | 892 | --- | --- | 109 | --- | --- |
| #140 | Scion xD | 778 | 6,265 | -87.6% | 12 | 508 | -97.6% |
| #141 | Cadillac ELR | 740 | 885 | -16.4% | 36 | 111 | -67.6% |
| #142 | Audi TT | 520 | 1,098 | -52.6% | 187 | 42 | 345% |
| #143 | Dodge Viper | 503 | 546 | -7.9% | 49 | 108 | -54.6% |
| #144 | Alfa Romeo 4C | 497 | --- | --- | 54 | --- | --- |
| #145 | Scion iQ | 465 | 1,752 | -73.5% | 7 | 132 | -94.7% |
| #146 | Audi R8 | 453 | 580 | -21.9% | 14 | 55 | -74.5% |
| #147 | Mazda 2 | 292 | 12,697 | -97.7% | 4 | 1,585 | -99.7% |
| #148 | Jaguar XK | 282 | 1,192 | -76.3% | 18 | 99 | -81.8% |
| #149 | Porsche 918 Spyder | 201 | 32 | 528% | 4 | 13 | -69.2% |
| #150 | Mitsubishi i MiEV | 93 | 149 | -37.6% | 3 | 15 | -80.0% |
| #151 | Acura TL | 86 | 10,357 | -99.2% | 1 | 142 | -99.3% |
| #152 | Volvo S60 Cross Country | 79 | --- | --- | 29 | --- | --- |
| #153 | Mercedes-Benz CL-Class | 54 | 178 | -69.7% | --- | 7 | -100% |
| #154 | Acura TSX | 32 | 6,202 | -99.5% | 1 | 58 | -98.3% |
| #155 | Mercedes-Benz SLS AMG | 27 | 212 | -87.3% | --- | 8 | -100% |
| #156 | Lexus LFA | 8 | 15 | -46.7% | 1 | --- | --- |
| #157 | Volvo C70 | 7 | 774 | -99.1% | --- | 5 | -100% |
| #158 | Mercedes-Benz R-Class | 4 | 7 | -42.9% | --- | --- | --- |
| #159 | Mitsubishi Galant | --- | 122 | -100% | --- | --- | --- |
| #160 | Volvo C30 | --- | 65 | -100% | --- | 1 | -100% |
| #161 | Mercedes-Benz CLK-Class | --- | 2 | -100% | --- | --- | --- |
| #162 | Honda FCX | --- | 1 | -100% | --- | --- | --- |
Total | 5,953,271 | 6,058,794 | -1.7% | 622,623 | 581,714 | 7.0% | |
--- | --- | --- | --- | --- | --- | --- |
* Italicized, asterisked, unranked lines are nothing more than available breakdowns, already included in the model's total, not in addition to the model's total.
² Total Prius Family sales: up 13% to 16,110 in September; down 14% to 141,940 YTD.
³ BMW has traditionally chosen to include sales of the 4-Series within figures for the 3-Series, presumably for year-over-year consistency's sake, while also combining the 1-Series and 2-Series. Now, since July, we have a 3-Series/4-Series breakdown. (Hyundai does the same with the Genesis and Genesis Coupe.)
Total 3-Series/4-Series sales: down 7% to 11,871 in September; up 9% to 103,582 YTD.
Sales data for brands such as Aston Martin, Ferrari, Lamborghini, Lotus, Rolls-Royce etc. are unfortunately not broken down by model. ANDC estimates say sales for Aston Martin and Lotus in the first nine months of 2015 were 765 and 113, respectively. The Wall Street Journal reports 1709 year-to-date Ferrari sales, 801 Lamborghini sales, and 636 Rolls-Royce sales. Tesla, unfortunately, doesn't release model-specific monthly U.S. sales data, but Automotive News now issues estimates for the brand, and those estimates say Tesla sold 1700 cars in September; 15,300 YTD. HybridCars.com estimates 2400 August Model S sales; 17,700 YTD, along with the first 6 copies of the Model X.
- Large Luxury Car Sales In Canada - September 2015 Ytd
In Mercedes-Benz Canada's best-ever September, Canadian sales of the S-Class more than doubled to 148 units, more than double the total achieved by any of its competitors. Canada Vehicle Sales Rankings By Model - September 2015 YTD Canada Car Sales...
- Large Luxury Car Sales In America - September 2015 Ytd
Although sales in its category continue to decline even during a spectacular month for the overall U.S. auto industry, the class-leading Mercedes-Benz S-Class posted a 2.5% increase to nearly 2000 sales in September 2015. U.S. Vehicle Sales Rankings By...
- Top 20 Best-selling Cars In America - September 2015
Having built up a 47,588-unit lead through the first three quarters of 2015, the Toyota Camry is securely ensconced in its position as America's best-selling car and will not surrender that title at year's end. The Camry began its current...
- July 2015 Ytd U.s. Passenger Car Sales Rankings - Top 155 Best-selling Cars In America - Every Car Ranked
Three of the five best-selling cars in America - along with four of the top six, nine of the top 15, 13 of the top 20 – posted declining year-over-year volume through the first seven months of 2015. Is it any wonder that car sales slid more than...
- September 2014 U.s. Passenger Car Sales Rankings - Top 155 Best-selling Cars In America - Every Car Ranked
Honda Accord sales in the United States accelerated at a rapid rate for the second consecutive month, enabling Honda to knock off the Toyota Camry as America's best-selling car in September 2014. Through the first nine months of 2014, the Camry...