Cars
Ten of America's 20 best-selling SUVs and crossovers wear Detroit badges, and three of the top five. But the Ford Escape, after leading the Honda CR-V through seven months, has been outsold by the CR-V by more than 7000 sales in the three months since.
Nevertheless, the top-ranked CR-V's lead is tenuous.
The Ford F-Series will end 2013 as America's best-selling truck. The Toyota Camry will end 2013 as America's best-selling car. We do not know if the CR-V will hold on to its 1093-unit lead. At this time last year, the CR-V was 13,679 sales ahead of the Escape.
Among premium brand utility vehicles, the Lexus RX is 35,379 sales ahead of the next-best-selling Cadillac SRX. The Lexus ranks 16th; the Cadillac is America's 27th-best-selling SUV or crossover.
5.3% of the SUVs and crossovers sold in America are full-size products from General Motors, Ford, Nissan, and Toyota. At 11.7%, full-size SUV growth seems strong - the overall new vehicle market isn't growing that fast, after all. But overall SUV/CUV sales are up 12.3% in 2013. Those same seven large SUVs accounted for 5.4% of the SUV market one year ago.
Meanwhile, the four best-selling utility vehicles in the United States - the smaller CR-V, Escape, Equinox, and RAV4 - make up 22.6% of the SUV/CUV market, up from 22.5% during the first ten months of 2012.
Premium automakers produce 15.3% of all SUV/CUV sales, up from 15.2% at this stage of 2012. Sales of SUVs and crossovers at Acura, Audi, BMW, Cadillac, Infiniti, Land Rover, Lexus, Lincoln, Mercedes-Benz, Porsche, and Volvo are up 12.5% through the first ten months of 2013.
New to the list this month: the 2014 Jeep Cherokee, which collected its first 579 sales in late October and currently sits in the 85th spot. (Mazda is also attributing a second sale to the defunct Tribute's YTD total, although we don't know in which month the sale occurred.)
There are substantial improvements in this month's ranking of vehicle sales. Prior year figures now include the actual numbers from last year, not just the percentage increase from last year. As a result, we've also included vehicles like the Dodge Nitro and Suzuki XL7, nameplates which collected sales in 2012 but were extinct before 2013 began. At any time, click the Rank column to return to the original format. If you're on a mobile device, you may need to choose the full version of the site (at the bottom of the page) in order to use the sortable function.
Reminder: these are year-to-date rankings, but you can sort utility vehicles by October volume by clicking the October 2013 column header, or you can rank SUVs and crossovers by improvements or declines using the % columns. Or, most importantly, you can list automakers together by selecting the SUV/Crossover column header. Just remember, the list is horizontally flipped from the norm: YTD on the left, monthly data on the right.
As always, you can find historical monthly and yearly sales figures for any of these vehicles by selecting a make and model at GCBC's Sales Stats page.
Click Column Headers To Sort • October 2014 • November 2013 • September 2013
Source: Automakers & ANDC
* Italicized unranked lines are nothing more than available breakdowns, already included in the model's total, not in addition to the model's total. Italicized unranked lines are nothing more than available breakdowns, already included in the model's total, not in addition to the model's total.
^ Escalade here does not include sales of the EXT, which is shown with pickup trucks.
Italicized unranked lines are nothing more than available breakdowns, already included in the model's total, not in addition to the model's total.
Rather than listing the 500L with the Mini Paceman and Countryman in these SUV/crossover rankings, it's with cars in large part because it is not available with all-wheel-drive. The placement of numerous crossovers often prompts disagreement, but consider the vehicle type's name: crossover. By its very definition, it crosses over from one category into another. The very act of calling, for example, the Toyota Venza a car or a utility vehicle requires ignorance of the fact that the Venza (or Outback, Crosstour, Encore, Countryman, 500L) is a square peg that can't be squeezed through a round hole. This post was updated at 4:08 PM AT on 11.06.2013 to reflect a change in Mazda's reporting that had previously attributed an RX-8 sale from January to the Tribute.
RECOMMENDED READING
U.S. SUV Sales Rankings By Model - October 2014 YTD
U.S. SUV/Crossover Sales Rankings By Model - November 2013 YTD
U.S. SUV/Crossover Sales Rankings By Model - September 2013 YTD
U.S. Vehicle Sales Rankings By Model - October 2013 YTD
U.S. Vehicle Sales Rankings By Model - October 2012 YTD
Top 20 Best-Selling SUVs In America - October 2013
U.S. Auto Sales Brand Rankings - October 2013 YTD
U.S. Pickup Truck Sales Rankings By Model - October 2013 YTD
U.S. Minivan Sales By Model - October 2013 YTD
U.S. Car Sales Rankings By Model - October 2013 YTD
- November 2014 U.s. Suv And Crossover Sales Rankings - Top 91 Best-selling Suvs In America - Every Suv Ranked
The Honda CR-V was not just America's best-selling utility vehicle in November 2014, it was America's best-selling non-truck. In other words, no passenger car sold as often as the CR-V in November; not the Honda Accord; not the Toyota Camry. •...
- October 2014 Canada Suv And Crossover Sales Rankings - Top 89 Best-selling Suvs In Canada - Every Suv Ranked
Canada's best-selling SUV, the Ford Escape, now ranks fourth among all vehicles, outselling the top-selling minivan and all but one car. At this stage of 2013, the Escape ranked seventh overall behind three truck nameplates, the Dodge Grand...
- November 2013 Canada Suv And Crossover Sales Rankings - Top 87 Best-selling Suvs In Canada - Every Suv Ranked
SUVs and crossovers attracted 33.5% of Canada's new vehicle buyers in November 2013, up from 30.8% in November 2012. Through eleven months, Canadian sales of SUVs and crossovers are up 7.8%. Canada's new vehicle market is up 6.5%. All utility...
- November 2013 U.s. Suv And Crossover Sales Rankings - Top 91 Best-selling Suvs In America - Every Suv Ranked
32.3% of the new vehicles sold in the United States in November 2013 were SUVs and crossovers of one kind or another. That's up from 31.5% a year ago. Year-over-year, SUV and crossover sales grew 11.7% as the overall industry collectively rose 8.7%....
- October 2013 Canada Suv And Crossover Sales Rankings - Top 87 Best-selling Suvs In Canada - Every Suv Ranked
Canada's auto industry reported nearly 10,000 more sales in October 2013 than it did in October 2012. The SUV/CUV market produced an increase of 4549 units. The remainder of the increase was not made up by passenger cars alone. Indeed, pickup truck...
Cars
October 2013 U.S. SUV And Crossover Sales Rankings - Top 91 Best-Selling SUVs In America - Every SUV Ranked
 |
| The Best-Selling Honda CR-V Leads The Ford Escape By 1093 Units Going Into November |
Nevertheless, the top-ranked CR-V's lead is tenuous.
The Ford F-Series will end 2013 as America's best-selling truck. The Toyota Camry will end 2013 as America's best-selling car. We do not know if the CR-V will hold on to its 1093-unit lead. At this time last year, the CR-V was 13,679 sales ahead of the Escape.
Among premium brand utility vehicles, the Lexus RX is 35,379 sales ahead of the next-best-selling Cadillac SRX. The Lexus ranks 16th; the Cadillac is America's 27th-best-selling SUV or crossover.
• U.S. Auto Sales Brand Rankings - October 2013 & YTD
• All 267 Vehicles Ranked By October 2013 YTD U.S. Sales
• All 155 Cars Ranked By October 2013 YTD U.S. Sales
• All 267 Vehicles Ranked By October 2013 YTD U.S. Sales
• All 155 Cars Ranked By October 2013 YTD U.S. Sales
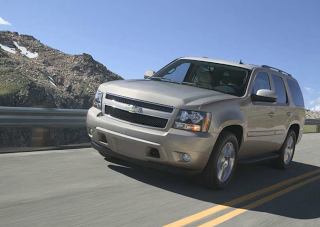 |
| GM's Market Share In The Large SUV Category Is 74% |
Meanwhile, the four best-selling utility vehicles in the United States - the smaller CR-V, Escape, Equinox, and RAV4 - make up 22.6% of the SUV/CUV market, up from 22.5% during the first ten months of 2012.
Premium automakers produce 15.3% of all SUV/CUV sales, up from 15.2% at this stage of 2012. Sales of SUVs and crossovers at Acura, Audi, BMW, Cadillac, Infiniti, Land Rover, Lexus, Lincoln, Mercedes-Benz, Porsche, and Volvo are up 12.5% through the first ten months of 2013.
New to the list this month: the 2014 Jeep Cherokee, which collected its first 579 sales in late October and currently sits in the 85th spot. (Mazda is also attributing a second sale to the defunct Tribute's YTD total, although we don't know in which month the sale occurred.)
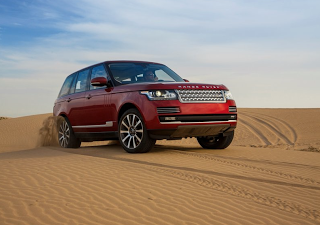 |
| The Range Rover's 194% YOY Increase Was Best Among SUVs and Crossovers In October 2013 |
Reminder: these are year-to-date rankings, but you can sort utility vehicles by October volume by clicking the October 2013 column header, or you can rank SUVs and crossovers by improvements or declines using the % columns. Or, most importantly, you can list automakers together by selecting the SUV/Crossover column header. Just remember, the list is horizontally flipped from the norm: YTD on the left, monthly data on the right.
As always, you can find historical monthly and yearly sales figures for any of these vehicles by selecting a make and model at GCBC's Sales Stats page.
Click Column Headers To Sort • October 2014 • November 2013 • September 2013
Rank | SUV/Crossover | October 2013 YTD | October 2012 YTD | % Change | October 2013 | October 2012 | % Change |
|---|---|---|---|---|---|---|---|
#1 | Honda CR-V | 251,636 | 233,586 | 7.7% | 22,554 | 20,205 | 11.6% |
#2 | Ford Escape | 250,543 | 219,907 | 13.9% | 22,253 | 19,832 | 12.2% |
#3 | Chevrolet Equinox | 202,583 | 182,249 | 11.2% | 17,163 | 15,387 | 11.5% |
#4 | Toyota RAV4 | 177,832 | 145,103 | 22.6% | 17,590 | 10,936 | 60.8% |
#5 | Ford Explorer | 161,222 | 132,023 | 22.1% | 15,288 | 14,220 | 7.5% |
#5.1 | Ford Explorer * | 149,431 | 121,793 | 17.5% | 13,584 | 13,538 | 0.3% |
#5.2 | Ford Explorer Police Interceptor * | 11,791 | 4830 | 144% | 1704 | 682 | 150% |
#6 | Jeep Grand Cherokee | 142,960 | 123,994 | 15.3% | 14,263 | 11,919 | 19.7% |
#7 | Nissan Rogue | 137,588 | 118,199 | 16.4% | 12,919 | 8,436 | 53.1% |
#8 | Jeep Wrangler | 131,721 | 119,787 | 10.0% | 11,780 | 11,310 | 4.2% |
#9 | Honda Pilot | 109,557 | 94,116 | 16.4% | 9,202 | 8,828 | 4.2% |
#10 | Ford Edge | 108,270 | 105,393 | 2.7% | 8,681 | 8,406 | 3.3% |
#11 | Toyota Highlander | 103,684 | 99,390 | 4.3% | 9,323 | 8,909 | 4.6% |
#12 | Subaru Forester | 96,953 | 61,880 | 56.7% | 12,581 | 5,309 | 137% |
#13 | Kia Sorento | 89,522 | 97,779 | -8.4% | 8,142 | 9,615 | -15.3% |
#14 | GMC Terrain | 84,706 | 78,112 | 8.4% | 7,914 | 7,286 | 8.6% |
#15 | Chevrolet Traverse | 81,776 | 72,479 | 12.8% | 6,365 | 5,437 | 17.1% |
#16 | Lexus RX | 81,258 | 73,976 | 9.8% | 7,979 | 6,928 | 15.2% |
#17 | Nissan Pathfinder | 75,156 | 26,585 | 183% | 5,793 | 3,043 | 90.4% |
#18 | GMC Acadia | 74,304 | 69,470 | 7.0% | 6,882 | 5,613 | 22.6% |
#19 | Dodge Journey | 71,162 | 65,306 | 9.0% | 6,373 | 5,955 | 7.0% |
#20 | Hyundai Santa Fe | 70,938 | 56,983 | 24.5% | 8,194 | 6,022 | 36.1% |
#21 | Chevrolet Tahoe | 67,584 | 54,407 | 24.2% | 7,458 | 4,926 | 51.4% |
#22 | Mazda CX-5 | 66,501 | 33,150 | 101% | 5,833 | 3,778 | 54.4% |
#23 | Jeep Patriot | 64,491 | 53,270 | 21.1% | 5,581 | 4,209 | 32.6% |
#24 | Buick Enclave | 51,028 | 45,834 | 11.3% | 4,644 | 4,273 | 8.7% |
#25 | Dodge Durango | 49,770 | 33,282 | 49.5% | 5,120 | 3,230 | 58.5% |
#26 | Jeep Compass | 45,912 | 34,389 | 33.5% | 4,176 | 2,486 | 68.0% |
#27 | Cadillac SRX | 45,879 | 45,745 | 0.3% | 5,373 | 5,521 | -2.7% |
#28 | Toyota 4Runner | 41,844 | 39,313 | 6.4% | 4,571 | 4,014 | 13.9% |
#29 | Chevrolet Captiva Sport | 40,490 | 30,556 | 32.5% | 4,197 | 3,408 | 23.2% |
#30 | Acura MDX | 40,411 | 42,417 | -4.7% | 5,608 | 3,771 | 48.7% |
#31 | Chevrolet Suburban | 40,228 | 37,455 | 7.4% | 5,648 | 3,595 | 57.1% |
#32 | Acura RDX | 36,872 | 22,460 | 64.2% | 3,333 | 2,659 | 25.3% |
#33 | Hyundai Tucson | 34,907 | 41,295 | -15.5% | 2,016 | 3,451 | -41.6% |
#34 | Nissan Murano | 34,280 | 42,547 | -19.4% | 3,102 | 3,225 | -3.8% |
#35 | BMW X5 | 33,439 | 33,922 | -1.4% | 2,140 | 4,240 | -49.5% |
#36 | Mercedes-Benz M-Class | 32,513 | 29,966 | 8.5% | 3,113 | 2,868 | 8.5% |
#37 | Audi Q5 | 31,979 | 22,321 | 43.3% | 3,380 | 2,424 | 39.4% |
#38 | Nissan Juke | 31,635 | 30,616 | 3.3% | 3,328 | 2,520 | 32.1% |
#39 | Ford Expedition | 30,533 | 31,170 | -2.0% | 3,151 | 2,943 | 7.1% |
#40 | Buick Encore | 26,532 | --- | --- | 3,602 | --- | --- |
#41 | Mercedes-Benz GLK-Class | 25,980 | 23,084 | 12.5% | 2,695 | 2,943 | -8.4% |
#42 | Kia Sportage | 25,745 | 32,392 | -20.5% | 2,513 | 2,223 | 13.0% |
#43 | GMC Yukon XL | 25,435 | 17,963 | 41.6% | 3,489 | 2,295 | 52.0% |
#44 | Volkswagen Tiguan | 25,303 | 25,606 | -1.2% | 2,153 | 2,752 | -21.8% |
#45 | Infiniti JX/QX60 | 24,843 | 16,437 | 51.1% | 2,176 | 2,084 | 4.4% |
#46 | Mercedes-Benz GL-Class | 24,747 | 19,854 | 24.6% | 2,565 | 2,296 | 11.7% |
#47 | BMW X3 | 22,884 | 25,839 | -11.4% | 2,819 | 3,248 | -13.2% |
#48 | GMC Yukon | 21,928 | 21,438 | 2.3% | 3,021 | 2,289 | 32.0% |
#49 | Mazda CX-9 | 21,783 | 18,804 | 15.8% | 1,352 | 1,465 | -7.7% |
#50 | Ford Flex | 21,450 | 24,404 | -12.1% | 1,623 | 1,444 | 12.4% |
#51 | BMW X1 | 21,407 | 4,053 | 428% | 3,059 | 1,907 | 60.4% |
#52 | Mitsubishi Outlander Sport | 20,534 | 14,801 | 38.7% | 2,009 | 1,675 | 19.9% |
#53 | Lincoln MKX | 19,420 | 20,382 | -4.7% | 2,022 | 1,602 | 26.2% |
#54 | Mini Countryman | 17,835 | 17,180 | 3.8% | 2,239 | 1,835 | 22.0% |
#55 | Volvo XC60 | 16,685 | 15,312 | 9.0% | 1,244 | 1,562 | -20.4% |
#56 | Cadillac Escalade ^ | 16,546 | 16,747 | -1.2% | 1,677 | 1,658 | 1.1% |
#56.1 | Cadillac Escalade * | 10,022 | 10,284 | -2.5% | 1069 | 990 | 8.0% |
#56.2 | Cadillac Escalade ESV * | 6524 | 6463 | 0.9% | 608 | 668 | -9.0% |
#57 | Porsche Cayenne | 15,582 | 12,031 | 29.5% | 1,669 | 1,697 | -1.6% |
#58 | Nissan Xterra | 14,733 | 14,500 | 1.6% | 1,114 | 1,000 | 11.4% |
#59 | Land Rover Range Rover Sport | 12,250 | 12,854 | -4.7% | 1,266 | 1,391 | -9.0% |
#60 | Audi Q7 | 12,175 | 8,354 | 45.7% | 1,403 | 1,012 | 38.6% |
#61 | Nissan Armada | 11,660 | 14,121 | -17.4% | 1,187 | 971 | 22.2% |
#62 | Toyota Sequoia | 11,228 | 10,255 | 9.5% | 1,169 | 1,019 | 14.7% |
#63 | Toyota FJ Cruiser | 10,676 | 10,981 | -2.8% | 926 | 1,061 | -12.7% |
#64 | Infiniti QX56/QX80 | 10,155 | 10,957 | -7.3% | 1,117 | 1,467 | -23.9% |
#65 | Mitsubishi Outlander | 9,599 | 6,527 | 47.1% | 1,023 | 618 | 65.5% |
#66 | Land Rover Range Rover | 9,589 | 6,457 | 48.5% | 1,184 | 403 | 194% |
#67 | Land Rover Range Rover Evoque | 9,128 | 6,880 | 32.7% | 959 | 645 | 48.7% |
#68 | Lexus GX460 | 8,603 | 8,629 | -0.3% | 1,498 | 909 | 64.8% |
#69 | Lincoln Navigator | 6,909 | 6,614 | 4.5% | 954 | 792 | 20.5% |
#70 | Volkswagen Touareg | 6,845 | 8,077 | -15.3% | 549 | 965 | -43.1% |
#71 | Jeep Liberty | 6,101 | 67,773 | -91.0% | --- | 4,099 | -100% |
#72 | Land Rover LR4 | 6,052 | 5,979 | 1.2% | 565 | 474 | 19.2% |
#73 | Volvo XC90 | 5,653 | 7,848 | -28.0% | 492 | 588 | -16.3% |
#74 | Infiniti FX/QX70 | 5,247 | 8,245 | -36.4% | 580 | 783 | -25.9% |
#75 | Lincoln MKT | 4,985 | 5,904 | -15.6% | 327 | 426 | -23.2% |
#76 | BMW X6 | 4,312 | 4,897 | -11.9% | 515 | 671 | -23.2% |
#77 | Lexus LX570 | 3,436 | 4,126 | -16.7% | 483 | 366 | 32.0% |
#78 | Land Rover LR2 | 2,626 | 2,633 | -0.3% | 312 | 216 | 44.4% |
#79 | Toyota Land Cruiser | 2,480 | 2,333 | 6.3% | 289 | 259 | 11.6% |
#80 | Mercedes-Benz G-Class | 2,072 | 911 | 127% | 194 | 160 | 21.3% |
#81 | Mini Paceman | 1,981 | --- | --- | 316 | --- | --- |
#82 | Infiniti EX/QX50 | 1,588 | 2,727 | -41.8% | 222 | 247 | -10.1% |
#83 | Subaru Tribeca | 1,348 | 1,722 | -21.7% | 101 | 184 | -45.1% |
#84 | Suzuki Grand Vitara | 1,037 | 4,283 | -75.8% | --- | 522 | -100% |
#85 | Jeep Cherokee | 579 | --- | --- | 579 | --- | --- |
#86 | Acura ZDX | 337 | 688 | -51.0% | 14 | 46 | -69.6% |
#87 | Hyundai Veracruz | 175 | 7,683 | -97.7% | --- | 343 | -100% |
#88 | Mitsubishi Endeavor | 24 | 488 | -95.1% | --- | 5 | -100% |
#89 | Honda Element | 2 | 3 | -33.3% | --- | --- | --- |
T91 | Mazda Tribute | 1 | 502 | -99.8% | --- | ---- | --- |
T91 | Mazda CX-7 | 1 | 11,327 | -99.99% | --- | --- | --- |
#92 | Dodge Nitro | --- | 3,269 | -100% | --- | 29 | -100% |
#93 | Suzuki XL7 | --- | 10 | -100% | --- | --- | --- |
--- | Total | 3,901,893 | 3,475,316 | 12.3% | 374,276 | 317,783 | 17.8% |
--- | --- | --- | --- | --- | --- | --- | --- |
* Italicized unranked lines are nothing more than available breakdowns, already included in the model's total, not in addition to the model's total. Italicized unranked lines are nothing more than available breakdowns, already included in the model's total, not in addition to the model's total.
^ Escalade here does not include sales of the EXT, which is shown with pickup trucks.
Italicized unranked lines are nothing more than available breakdowns, already included in the model's total, not in addition to the model's total.
Rather than listing the 500L with the Mini Paceman and Countryman in these SUV/crossover rankings, it's with cars in large part because it is not available with all-wheel-drive. The placement of numerous crossovers often prompts disagreement, but consider the vehicle type's name: crossover. By its very definition, it crosses over from one category into another. The very act of calling, for example, the Toyota Venza a car or a utility vehicle requires ignorance of the fact that the Venza (or Outback, Crosstour, Encore, Countryman, 500L) is a square peg that can't be squeezed through a round hole. This post was updated at 4:08 PM AT on 11.06.2013 to reflect a change in Mazda's reporting that had previously attributed an RX-8 sale from January to the Tribute.
RECOMMENDED READING
U.S. SUV Sales Rankings By Model - October 2014 YTD
U.S. SUV/Crossover Sales Rankings By Model - November 2013 YTD
U.S. SUV/Crossover Sales Rankings By Model - September 2013 YTD
U.S. Vehicle Sales Rankings By Model - October 2013 YTD
U.S. Vehicle Sales Rankings By Model - October 2012 YTD
Top 20 Best-Selling SUVs In America - October 2013
U.S. Auto Sales Brand Rankings - October 2013 YTD
U.S. Pickup Truck Sales Rankings By Model - October 2013 YTD
U.S. Minivan Sales By Model - October 2013 YTD
U.S. Car Sales Rankings By Model - October 2013 YTD
- November 2014 U.s. Suv And Crossover Sales Rankings - Top 91 Best-selling Suvs In America - Every Suv Ranked
The Honda CR-V was not just America's best-selling utility vehicle in November 2014, it was America's best-selling non-truck. In other words, no passenger car sold as often as the CR-V in November; not the Honda Accord; not the Toyota Camry. •...
- October 2014 Canada Suv And Crossover Sales Rankings - Top 89 Best-selling Suvs In Canada - Every Suv Ranked
Canada's best-selling SUV, the Ford Escape, now ranks fourth among all vehicles, outselling the top-selling minivan and all but one car. At this stage of 2013, the Escape ranked seventh overall behind three truck nameplates, the Dodge Grand...
- November 2013 Canada Suv And Crossover Sales Rankings - Top 87 Best-selling Suvs In Canada - Every Suv Ranked
SUVs and crossovers attracted 33.5% of Canada's new vehicle buyers in November 2013, up from 30.8% in November 2012. Through eleven months, Canadian sales of SUVs and crossovers are up 7.8%. Canada's new vehicle market is up 6.5%. All utility...
- November 2013 U.s. Suv And Crossover Sales Rankings - Top 91 Best-selling Suvs In America - Every Suv Ranked
32.3% of the new vehicles sold in the United States in November 2013 were SUVs and crossovers of one kind or another. That's up from 31.5% a year ago. Year-over-year, SUV and crossover sales grew 11.7% as the overall industry collectively rose 8.7%....
- October 2013 Canada Suv And Crossover Sales Rankings - Top 87 Best-selling Suvs In Canada - Every Suv Ranked
Canada's auto industry reported nearly 10,000 more sales in October 2013 than it did in October 2012. The SUV/CUV market produced an increase of 4549 units. The remainder of the increase was not made up by passenger cars alone. Indeed, pickup truck...