Cars
 Only one of Canada's seven-best-selling cars has managed to post improved sales through the first-half of 2015.
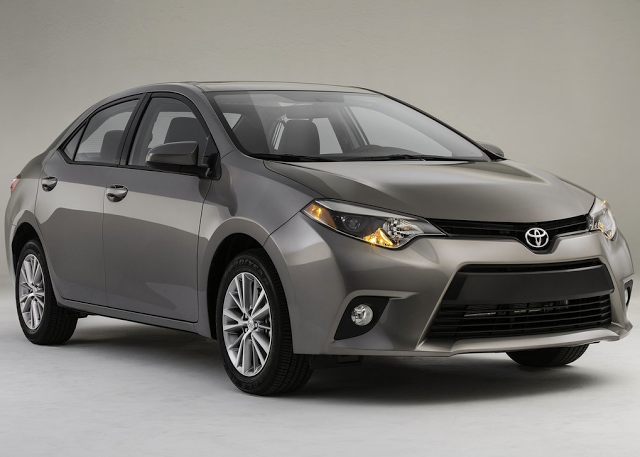
The second-ranked Toyota Corolla, which trails the top-selling Honda Civic by 3791 units, is up 1%, a modest gain of just 253 units compared with the first six months of 2014.
Canada Auto Sales Brand Rankings - June 2015 YTD
Canada Vehicle Sales Brand Rankings - June 2015 YTD
Canada SUV/Crossover Sales Rankings By Model - June 2015 YTD
Meanwhile, Canadian sales of the Honda Civic, Hyundai Elantra, Mazda 3, Chevrolet Cruze, Volkswagen Jetta, and Ford Focus are down 10% so far this year. That's bad. In fact, it's worse than the 2% decline posted by the overall passenger car market.
June was a particularly poor month for car sales. The 11% drop occurred as the Hyundai Elantra lost nearly half its volume, year-over-year, as the Hyundai Accent tumbled 21%, as the Ford Fusion plunged 40%, and as the Dodge Dart became one of the country's worst-selling cars.
Canada Car Sales Rankings By Model - July 2015 YTD
Canada Car Sales Rankings By Model - May 2015 YTD
Canada Car Sales Rankings By Model - June 2014 YTD
Reminder: these are year-to-date rankings, but you can sort cars by June 2015 volume by clicking the June 2015 column header, or you can rank them by improvements or declines using the % columns. Or, most importantly, you can list automakers together by selecting the Car column header. At any time, click the Rank column to return to the original format. If you're on a mobile device, you may need to choose the full version of the site (at the bottom of the page) in order to use the sortable function.
Top 20 Best-Selling Cars In Canada - June 2015
Top 20 Best-Selling SUVs In Canada - June 2015
Canada Pickup Truck Sales By Model - June 2015 YTD
Canada Minivan Sales By Model - June 2015 YTD
Canada Commercial Van Sales By Model - June 2015 YTD
As always, you can find historical monthly and yearly sales figures for any of these vehicles by selecting a make and model at GCBC's Sales Stats page.
Click Column Headers To Sort • July 2015 • May 2015 • June 2014
Source: Automakers & Global Automakers Of Canada & ANDC
* Italicized unranked lines are nothing more than available breakdowns, already included in the model's total, not in addition to the model's total.
² Total Prius Family sales: up 10.5% to 695 in June; up 4.2% to 3705 YTD.
†Mini Cooper includes sales of the Hardtop, Convertible, Clubman, Coupe, Roadster, and Paceman.
‡ Total Genesis sales: down 51.9% to 175 in June; down 11.2% to 1413 YTD.
¤ Automakers release sales figures for the E-Class and CLS-Class together and the Passat and CC together.
º Audi's A4 sales data includes sales of the Allroad.
Sales data for brands such as Bentley, Ferrari, Lamborghini, and Rolls-Royce are unfortunately not broken down by model. ANDC estimates say sales for those brands in the first six months of of 2015 were 71, 108, 60, and 37, respectively. Total Maserati volume is reported, but not by specific models. It is believed that Tesla sold 742 copies of their Model S during the first five months of 2015. The ANDC estimate for Tesla June sales in Canada was 51 units and 306 YTD.
- July 2015 Ytd Canada Passenger Car Sales Rankings - Top 144 Best-selling Cars In Canada - Every Car Ranked
Canadian sales of passenger cars took an especially sharp dive in the month of July. After 2015's first-half saw car sales in Canada fall 2%, the 10% dive in July 2015 built upon June's 11% drop to drag car sales down by more than 3% through the...
- Gcbc's Most Popular Auto Sales Figures - July 2015
During the month in which GCBC published a review of the 2015 Ford Mustang EcoBoost Convertible, the most popular review on the site once again featured the 2015 Ford Mustang V6. Month after month, for five months running, our review of the white Mustang...
- Large Suv Sales In Canada - June 2015 Ytd
During a month in which U.S. sales of full-size, volume brand SUVs plunged, Canadian sales in the same category leaped forward 32.5% compared with June 2014. June 2015 sales of the Ford Expedition-led, GM-dominated large SUV class increased by...
- Gcbc's Most Popular Auto Sales Figures - June 2015
As goes the market, so go the pageviews at GoodCarBadCar. The Ford F-Series is North America's best-selling new vehicle line, and the Ford F-Series' sales tracking page is the most popular model-specific sales tracking page at GoodCarBadCar. ...
- May 2015 Ytd Canada Passenger Car Sales Rankings - Top 144 Best-selling Cars In Canada - Every Car Ranked
Canadian sales of the Honda Civic, Toyota Corolla, Hyundai Elantra, Mazda 3, Chevrolet Cruze, and Mazda 3 were lower, in every case, through the first five months of 2015 than during the same period one year earlier. Why is this important? Those are...
Cars
June 2015 YTD Canada Passenger Car Sales Rankings - Top 144 Best-Selling Cars In Canada - Every Car Ranked
The second-ranked Toyota Corolla, which trails the top-selling Honda Civic by 3791 units, is up 1%, a modest gain of just 253 units compared with the first six months of 2014.
Canada Auto Sales Brand Rankings - June 2015 YTD
Canada Vehicle Sales Brand Rankings - June 2015 YTD
Canada SUV/Crossover Sales Rankings By Model - June 2015 YTD
Meanwhile, Canadian sales of the Honda Civic, Hyundai Elantra, Mazda 3, Chevrolet Cruze, Volkswagen Jetta, and Ford Focus are down 10% so far this year. That's bad. In fact, it's worse than the 2% decline posted by the overall passenger car market.
June was a particularly poor month for car sales. The 11% drop occurred as the Hyundai Elantra lost nearly half its volume, year-over-year, as the Hyundai Accent tumbled 21%, as the Ford Fusion plunged 40%, and as the Dodge Dart became one of the country's worst-selling cars.
Canada Car Sales Rankings By Model - July 2015 YTD
Canada Car Sales Rankings By Model - May 2015 YTD
Canada Car Sales Rankings By Model - June 2014 YTD
Reminder: these are year-to-date rankings, but you can sort cars by June 2015 volume by clicking the June 2015 column header, or you can rank them by improvements or declines using the % columns. Or, most importantly, you can list automakers together by selecting the Car column header. At any time, click the Rank column to return to the original format. If you're on a mobile device, you may need to choose the full version of the site (at the bottom of the page) in order to use the sortable function.
Top 20 Best-Selling Cars In Canada - June 2015
Top 20 Best-Selling SUVs In Canada - June 2015
Canada Pickup Truck Sales By Model - June 2015 YTD
Canada Minivan Sales By Model - June 2015 YTD
Canada Commercial Van Sales By Model - June 2015 YTD
As always, you can find historical monthly and yearly sales figures for any of these vehicles by selecting a make and model at GCBC's Sales Stats page.
Click Column Headers To Sort • July 2015 • May 2015 • June 2014
Rank | Car | June 2015 YTD | June 2014 YTD | % Change | June 2015 | June 2014 | % Change |
|---|---|---|---|---|---|---|---|
| #1 | Honda Civic | 29,589 | 30,696 | -3.6% | 6,030 | 6,461 | -6.7% |
| #2 | Toyota Corolla | 25,798 | 25,545 | 1.0% | 5,377 | 4,656 | 15.5% |
| #3 | Hyundai Elantra | 22,350 | 26,936 | -17.0% | 3,325 | 6,254 | -46.8% |
| #4 | Mazda 3 | 18,513 | 20,831 | -11.1% | 3,522 | 3,703 | -4.9% |
| #5 | Chevrolet Cruze | 15,776 | 17,335 | -9.0% | 2,848 | 2,759 | 3.2% |
| #6 | Volkswagen Jetta | 15,053 | 16,439 | -8.4% | 2,573 | 3,087 | -16.7% |
| #7 | Ford Focus | 10,429 | 11,789 | -11.5% | 2,205 | 2,577 | -14.4% |
| #8 | Volkswagen Golf | 10,416 | 2,603 | 300% | 1,849 | 1,069 | 73.0% |
| #8.1 | Volkswagen Golf * | 8,926 | 1,861 | 380% | 1,593 | 660 | 141% |
| #8.2 | Volkswagen Golf GTI * | 1,490 | 742 | 101% | 256 | 409 | -37.4% |
| #9 | Hyundai Accent | 10,287 | 11,445 | -10.1% | 1,952 | 2,473 | -21.1% |
| #10 | Toyota Camry | 9,416 | 8,026 | 17.3% | 1,894 | 1,464 | 29.4% |
| #11 | Nissan Sentra | 7,885 | 7,626 | 3.4% | 1,491 | 1,975 | -24.5% |
| #12 | Ford Fusion | 7,690 | 9,777 | -21.3% | 1,433 | 2,373 | -39.6% |
| #13 | Honda Accord | 7,142 | 8,860 | -19.4% | 1,446 | 1,594 | -9.3% |
| #14 | Hyundai Sonata | 6,947 | 5,257 | 32.1% | 885 | 1,142 | -22.5% |
| #15 | Kia Forte | 6,756 | 6,028 | 12.1% | 1,601 | 1,374 | 16.5% |
| #16 | Chrysler 200 | 6,342 | 4,497 | 41.0% | 810 | 1,127 | -28.1% |
| #16.1 | Chrysler 200 * | 6,342 | 4,483 | 41.5% | 810 | 1,126 | -28.1% |
| #16.2 | Chrysler 200 Convertible * | --- | 14 | -100% | --- | 1 | -100% |
| #17 | Kia Soul | 6,338 | 4,339 | 46.1% | 1,652 | 731 | 126% |
| #18 | Nissan Micra | 6,024 | 2,007 | 200% | 1,056 | 929 | 13.7% |
| #19 | Subaru Impreza | 5,846 | 5,060 | 15.5% | 1,042 | 871 | 19.6% |
| #19.1 | Subaru Impreza WRX/STi * | 1,526 | 1,339 | 14.0% | 237 | 226 | 4.9% |
| #19.2 | Subaru Impreza * | 4,320 | 3,721 | 16.1% | 805 | 645 | 24.8% |
| #20 | Honda Fit | 5,674 | 6,380 | -11.1% | 918 | 1,517 | -39.5% |
| #21 | Mercedes-Benz C-Class | 5,508 | 3,408 | 61.6% | 970 | 717 | 35.3% |
| #22 | Chevrolet Malibu | 5,482 | 2,942 | 86.3% | 772 | 327 | 136% |
| #23 | Kia Rio | 5,239 | 7,682 | -31.8% | 779 | 1,416 | -45.0% |
| #24 | Subaru Outback | 5,141 | 3,342 | 53.8% | 841 | 534 | 57.5% |
| #25 | Nissan Versa | 4,755 | 7,977 | -40.4% | 770 | 1,659 | -53.6% |
| #26 | BMW 3-Series | 4,478 | 4,393 | 1.9% | 843 | 1,056 | -20.2% |
| #27 | Ford Mustang | 4,266 | 3,115 | 37.0% | 972 | 622 | 56.3% |
| #28 | Toyota Yaris | 4,117 | 4,304 | -4.3% | 708 | 859 | -17.6% |
| #29 | Nissan Altima | 4,110 | 4,484 | -8.3% | 637 | 981 | -35.1% |
| #30 | Subaru XV Crosstrek | 3,978 | 3,486 | 14.1% | 752 | 657 | 14.5% |
| #31 | Dodge Charger | 3,352 | 2,582 | 29.8% | 377 | 225 | 67.6% |
| #32 | Chrysler 300 | 3,341 | 3,077 | 8.6% | 613 | 817 | -25.0% |
| #33 | Chevrolet Sonic | 3,325 | 4,671 | -28.8% | 577 | 872 | -33.8% |
| #34 | Toyota Venza | 3,217 | 4,078 | -21.1% | 613 | 711 | -13.8% |
| #35 | Volkswagen Passat & CC ¤ | 3,131 | 4,062 | -22.9% | 551 | 700 | -21.3% |
| #36 | Mitsubishi Lancer | 3,051 | 3,123 | -2.3% | 697 | 486 | 43.4% |
| #37 | Buick Verano | 2,979 | 3,266 | -8.8% | 713 | 587 | 21.5% |
| #38 | Kia Optima | 2,976 | 4,878 | -39.0% | 420 | 1,249 | -66.4% |
| #39 | Audi A4 º | 2,974 | 3,022 | -1.6% | 488 | 485 | 0.6% |
| #40 | BMW 4-Series | 2,694 | 1,368 | 96.9% | 619 | 395 | 56.7% |
| #41 | Mini Cooper †| 2,661 | 1,375 | 93.5% | 538 | 376 | 43.1% |
| #42 | Ford Fiesta | 2,432 | 4,933 | -50.7% | 528 | 1,037 | -49.1% |
| #43 | Acura TLX | 2,354 | --- | --- | 352 | --- | --- |
| #44 | Ford Taurus | 2,141 | 2,064 | 3.7% | 633 | 441 | 43.5% |
| #45 | Audi A3 | 2,085 | 675 | 209% | 425 | 276 | 54.0% |
| #46 | Dodge Dart | 1,979 | 4,362 | -54.6% | 220 | 1,064 | -79.3% |
| #47 | Mercedes-Benz CLA-Class | 1,931 | 1,766 | 9.3% | 350 | 351 | -0.3% |
| #48 | Dodge Challenger | 1,925 | 893 | 116% | 326 | 131 | 149% |
| #49 | Subaru Legacy | 1,871 | 1,129 | 65.7% | 312 | 150 | 108% |
| #50 | Mitsubishi Mirage | 1,835 | 2,132 | -13.9% | 228 | 470 | -51.5% |
| #51 | Hyundai Veloster | 1,766 | 1,786 | -1.1% | 272 | 272 | 0.0% |
| #52 | Chevrolet Camaro | 1,764 | 1,837 | -4.0% | 312 | 382 | -18.3% |
| #53 | Lexus IS | 1,749 | 2,001 | -12.6% | 328 | 354 | -7.3% |
| #54 | Fiat 500L | 1,703 | 1,644 | 3.6% | 134 | 284 | -52.8% |
| #55 | Toyota Prius C ² | 1,677 | 1,417 | 18.3% | 278 | 274 | 1.5% |
| #56 | Mercedes-Benz E-Class & CLS-Class ¤ | 1,620 | 1,832 | -11.6% | 352 | 324 | 8.6% |
| #57 | Fiat 500 | 1,610 | 3,433 | -53.1% | 243 | 570 | -57.4% |
| #57.1 | Fiat 500 * | 1,173 | 2,366 | -50.4% | 178 | 417 | -57.3% |
| #57.2 | Fiat 500 Convertible * | 437 | 1,067 | -59.0% | 65 | 153 | -57.5% |
| #58 | Infiniti Q50 | 1,501 | 1,726 | -13.0% | 257 | 274 | -6.2% |
| #59 | Cadillac ATS | 1,460 | 1,759 | -17.0% | 265 | 333 | -20.4% |
| #60 | Volkswagen Beetle | 1,421 | 1,151 | 23.5% | 243 | 142 | 71.1% |
| #61 | Chevrolet Impala | 1,419 | 1,775 | -20.1% | 278 | 200 | 39.0% |
| #62 | Mazda 6 | 1,367 | 1,605 | -14.8% | 271 | 290 | -6.6% |
| #63 | Toyota Prius V ² | 1,188 | 1,151 | 3.2% | 265 | 187 | 41.7% |
| #64 | Lexus ES | 1,176 | 1,271 | -7.5% | 240 | 262 | -8.4% |
| #65 | Acura ILX | 1,153 | 1,449 | -20.4% | 213 | 300 | -29.0% |
| #66 | Chevrolet Corvette | 1,145 | 756 | 51.5% | 251 | 159 | 57.9% |
| #67 | Mercedes-Benz B-Class | 1,089 | 1,399 | -22.2% | 176 | 285 | -38.2% |
| #68 | Audi A5 | 947 | 1,223 | -22.6% | 206 | 204 | 1.0% |
| #69 | BMW 5-Series | 874 | 1,046 | -16.4% | 197 | 300 | -34.3% |
| #70 | Toyota Prius ² | 840 | 986 | -14.8% | 152 | 168 | -9.5% |
| #71 | BMW 2-Series | 793 | 286 | 177% | 193 | 88 | 119% |
| #72 | Hyundai Genesis Sedan ‡ | 778 | 678 | 14.7% | 97 | 220 | -55.9% |
| #73 | Chevrolet Spark | 726 | 947 | -23.3% | 93 | 82 | 13.4% |
| #74 | Scion FR-S | 696 | 839 | -17.0% | 162 | 210 | -22.9% |
| #75 | Hyundai Genesis Coupe ‡ | 635 | 914 | -30.5% | 78 | 144 | -45.8% |
| #76 | Mazda 2 | 615 | 1,184 | -48.1% | 83 | 143 | -42.0% |
| #77 | Scion tC | 605 | 619 | -2.3% | 142 | 127 | 11.8% |
| #78 | Volvo V60 | 582 | 523 | 11.3% | 97 | 150 | -35.3% |
| #79 | Scion xB | 578 | 347 | 66.6% | 83 | 69 | 20.3% |
| #80 | Buick Regal | 575 | 345 | 66.7% | 64 | 51 | 25.5% |
| #81 | Lincoln MKZ | 552 | 875 | -36.9% | 83 | 109 | -23.9% |
| #82 | Mercedes-Benz S-Class | 548 | 582 | -5.8% | 110 | 102 | 7.8% |
| #83 | Subaru BRZ | 510 | 577 | -11.6% | 120 | 128 | -6.3% |
| T84 | Buick LaCrosse | 488 | 637 | -23.4% | 58 | 87 | -33.3% |
| T84 | Nissan Leaf | 488 | 462 | 5.6% | 101 | 104 | -2.9% |
| #86 | Porsche 911 | 476 | 431 | 10.4% | 92 | 100 | -8.0% |
| #87 | Audi A6 | 475 | 567 | -16.2% | 112 | 119 | -5.9% |
| #88 | Nissan Maxima | 466 | 432 | 7.9% | 217 | 52 | 317% |
| #89 | Lexus CT200h | 453 | 545 | -16.9% | 93 | 92 | 1.1% |
| #90 | Toyota Avalon | 447 | 514 | -13.0% | 84 | 70 | 20.0% |
| #91 | Chevrolet Volt | 425 | 831 | -48.9% | 120 | 163 | -26.4% |
| #92 | Volvo S60 | 386 | 658 | -41.3% | 62 | 146 | -57.5% |
| #93 | Lexus RC | 380 | --- | --- | 56 | --- | --- |
| #94 | Cadillac CTS | 379 | 560 | -32.3% | 60 | 85 | -29.4% |
| #95 | Audi A7 | 376 | 535 | -29.7% | 99 | 93 | 6.5% |
| #96 | Smart Fortwo | 370 | 904 | -59.1% | 63 | 198 | -68.2% |
| #97 | Cadillac XTS | 337 | 350 | -3.7% | 62 | 66 | -6.1% |
| #98 | Nissan 370Z | 309 | 238 | 29.8% | 71 | 56 | 26.8% |
| #99 | Toyota Matrix | 295 | 3,889 | -92.4% | --- | 829 | -100% |
| #100 | Jaguar XF | 286 | 308 | -7.1% | 37 | 37 | 0.0% |
| #101 | Ford C-Max | 279 | 754 | -63.0% | 63 | 187 | -66.3% |
| #102 | BMW 6-Series | 275 | 243 | 13.2% | 39 | 42 | -7.1% |
| #103 | Volkswagen Eos | 272 | 264 | 3.0% | 76 | 58 | 31.0% |
| #104 | Mazda MX-5 Miata | 269 | 349 | -22.9% | 60 | 85 | -29.4% |
| #105 | Jaguar F-Type | 262 | 256 | 2.3% | 73 | 78 | -6.4% |
| #106 | Honda Crosstour | 258 | 412 | -37.4% | 26 | 76 | -65.8% |
| #107 | BMW i3 | 255 | 50 | 410% | 49 | 28 | 75.0% |
| #108 | Volvo XC70 | 250 | 282 | -11.3% | 52 | 75 | -30.7% |
| #109 | Infiniti Q60 | 229 | 239 | -4.2% | 45 | 69 | -34.8% |
| #110 | Lexus GS | 212 | 258 | -17.8% | 40 | 44 | -9.1% |
| #111 | Porsche Boxster | 190 | 203 | -6.4% | 46 | 46 | 0.0% |
| #112 | Mercedes-Benz SL-Class | 175 | 195 | -10.3% | 47 | 43 | 9.3% |
| #113 | Mercedes-Benz SLK-Class | 164 | 207 | -20.8% | 26 | 42 | -38.1% |
| #114 | Porsche Panamera | 152 | 182 | -16.5% | 31 | 33 | -6.1% |
| #115 | BMW 7-Series | 137 | 169 | -18.9% | 31 | 37 | -16.2% |
| #116 | Audi A8 | 136 | 130 | 4.6% | 35 | 27 | 29.6% |
| #117 | Jaguar XJ | 129 | 175 | -26.3% | 24 | 38 | -36.8% |
| #118 | Porsche Cayman | 127 | 145 | -12.4% | 33 | 37 | -10.8% |
| #119 | Scion iQ | 125 | 221 | -43.4% | 24 | 19 | 26.3% |
| #120 | Infiniti Q70 | 113 | 43 | 163% | 16 | 7 | 129% |
| #121 | Lincoln MKS | 109 | 138 | -21.0% | 15 | 11 | 36.4% |
| #122 | Acura RLX | 99 | 173 | -42.8% | 11 | 18 | -38.9% |
| #123 | Dodge Viper | 91 | 70 | 30.0% | 13 | 21 | -38.1% |
| #124 | Kia Cadenza | 90 | 57 | 57.9% | 10 | 11 | -9.1% |
| #125 | Lexus LS | 80 | 97 | -17.5% | 13 | 20 | -35.0% |
| #126 | Audi R8 | 79 | 74 | 6.8% | 19 | 12 | 58.3% |
| #127 | Mitsubishi i MiEV | 72 | 54 | 33.3% | 16 | 12 | 33.3% |
| #128 | BMW Z4 | 69 | 116 | -40.5% | 16 | 15 | 6.7% |
| #129 | Nissan GT-R | 67 | 76 | -11.8% | 11 | 16 | -31.3% |
| #130 | Mercedes-AMG GT | 58 | --- | --- | 24 | --- | --- |
| #131 | Volvo S80 | 58 | 44 | 31.8% | 9 | 14 | -35.7% |
| #132 | Honda CR-Z | 41 | 48 | -14.6% | 8 | 15 | -46.7% |
| #133 | Scion xD | 27 | 167 | -83.8% | --- | 23 | -100% |
| #134 | Alfa Romeo 4C | 25 | --- | --- | 8 | --- | --- |
| T135 | Audi TT | 24 | 182 | -86.8% | 4 | 34 | -88.2% |
| T135 | Jaguar XK | 24 | 43 | -44.2% | 5 | 10 | -50.0% |
| #137 | Cadillac ELR | 21 | 13 | 61.5% | 3 | 3 | 0.0% |
| T138 | Hyundai Equus | 18 | 36 | -50.0% | 2 | 8 | -75.0% |
| T138 | Kia K900 | 18 | 10 | 80.0% | 3 | 3 | 0.0% |
| #140 | Porsche 918 Spyder | 14 | --- | --- | 3 | --- | --- |
| #141 | Dodge Avenger | 8 | 452 | -98.2% | --- | 33 | -100% |
| #142 | BMW 1-Series | 3 | 2 | 50.0% | --- | --- | --- |
| #143 | Nissan Cube | 2 | 14 | -85.7% | --- | 1 | -100% |
| #144 | Mercedes-Benz R-Class | 1 | --- | --- | --- | --- | --- |
| #146 | Acura TL | --- | 949 | -100% | --- | 131 | -100% |
| #147 | Acura TSX | --- | 205 | -100% | --- | 2 | -100% |
| #148 | Mercedes-Benz SLS AMG | --- | 31 | -100% | --- | 4 | -100% |
| #149 | Lexus LFA | --- | 1 | -100% | --- | --- | --- |
| #150 | Volvo C70 | --- | 1 | -100% | --- | --- | --- |
--- | Total | 381,204 | 389,719 | -2.2% | 70,287 | 78,759 | -10.8% |
--- | --- | --- | --- | --- | --- | --- | --- |
* Italicized unranked lines are nothing more than available breakdowns, already included in the model's total, not in addition to the model's total.
² Total Prius Family sales: up 10.5% to 695 in June; up 4.2% to 3705 YTD.
†Mini Cooper includes sales of the Hardtop, Convertible, Clubman, Coupe, Roadster, and Paceman.
‡ Total Genesis sales: down 51.9% to 175 in June; down 11.2% to 1413 YTD.
¤ Automakers release sales figures for the E-Class and CLS-Class together and the Passat and CC together.
º Audi's A4 sales data includes sales of the Allroad.
Sales data for brands such as Bentley, Ferrari, Lamborghini, and Rolls-Royce are unfortunately not broken down by model. ANDC estimates say sales for those brands in the first six months of of 2015 were 71, 108, 60, and 37, respectively. Total Maserati volume is reported, but not by specific models. It is believed that Tesla sold 742 copies of their Model S during the first five months of 2015. The ANDC estimate for Tesla June sales in Canada was 51 units and 306 YTD.
- July 2015 Ytd Canada Passenger Car Sales Rankings - Top 144 Best-selling Cars In Canada - Every Car Ranked
Canadian sales of passenger cars took an especially sharp dive in the month of July. After 2015's first-half saw car sales in Canada fall 2%, the 10% dive in July 2015 built upon June's 11% drop to drag car sales down by more than 3% through the...
- Gcbc's Most Popular Auto Sales Figures - July 2015
During the month in which GCBC published a review of the 2015 Ford Mustang EcoBoost Convertible, the most popular review on the site once again featured the 2015 Ford Mustang V6. Month after month, for five months running, our review of the white Mustang...
- Large Suv Sales In Canada - June 2015 Ytd
During a month in which U.S. sales of full-size, volume brand SUVs plunged, Canadian sales in the same category leaped forward 32.5% compared with June 2014. June 2015 sales of the Ford Expedition-led, GM-dominated large SUV class increased by...
- Gcbc's Most Popular Auto Sales Figures - June 2015
As goes the market, so go the pageviews at GoodCarBadCar. The Ford F-Series is North America's best-selling new vehicle line, and the Ford F-Series' sales tracking page is the most popular model-specific sales tracking page at GoodCarBadCar. ...
- May 2015 Ytd Canada Passenger Car Sales Rankings - Top 144 Best-selling Cars In Canada - Every Car Ranked
Canadian sales of the Honda Civic, Toyota Corolla, Hyundai Elantra, Mazda 3, Chevrolet Cruze, and Mazda 3 were lower, in every case, through the first five months of 2015 than during the same period one year earlier. Why is this important? Those are...