Cars
You already know Korea's autombile manufacturing industry is stronger than ever. You heard that the 2011 Hyundai Sonata was one of America's best-selling cars in 2010. You recently read about the Hyundai Genesis becoming America's 17th most-popular luxury car. A simple windshield survey will tell you the 2011 Kia Sorento is a hit - and GoodCarBadCar.net confirms it. And as a prelude to 2011, December 2010 had the all-new and very handsome 2011 Hyundai Elantra as one of America's ten top-selling cars.
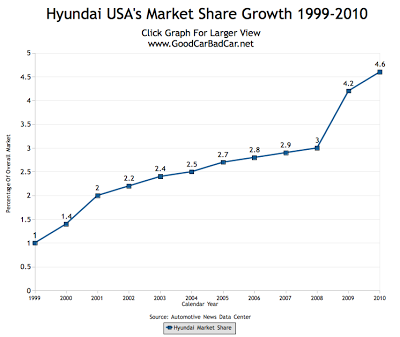
Then yesterday GoodCarBadCar.net's audience scanned a couple Graphs displaying Hyundai's ability to grow their sales in the United States even when the market shrinks. And this market share pie chart from January 5th said plenty about Korea's strong standing in the U.S. marketplace, right? Well, yeah, it was pretty clear. But the chart below, yes that's the one, says more about Hyundai's growth in America than any chart GoodCarBadCar.net has ever displayed.
Starting in 1999 when Hyundai sold one out of every hundred new cars registered in America, to 2001 when Hyundai doubled its market share in just two years, to 2009 when the company's market share more than doubled, Hyundai is now parked at 4.6% of the overall U.S. automobile market. Parked? That's probably far too strong a word. Based on trends over the last twelve years, if Hyundai doesn't increase its U.S. market share, that'd be a colossal disappointment, particularly given the advent of a new Elantra, the terrific 2012 Hyundai Accent Autoguide.com covered yesterday, and the sporty 2012 Hyundai Veloster revealed in Detroit.
While we're on the subject of U.S. auto-selling market share, there are nine other significant swings from 2010, as contrasted with the company's 2009 numbers, posted below the Hyundai chart.
 Ford: up to 15.1% from 13.8%
Chevrolet: up to 13.5% from 12.8%
Toyota: down to 12.8% from 14.3%
Honda: down to 9.5% from 10%
Nissan: up to 6.9% from 6.6%
GMC: up to 2.9% from 2.4%
Jeep: up to 2.5% from 2.2%
Scion: down to 0.4% from 0.6%
Suzuki: down to 0.2% from 0.4%
Related From GoodCarBadCar.net
Hyundai USA Sales Figures & Percentage Growth In 2010
Hyundai Santa Fe 2.4 GL Driven
U.S. Auto Sales By Brand - 2010 Year End
- U.s. Auto Brand Market Share Chart - November 2011
America's car market grew by 13.9% in November 2011. This means Americans acquired 121,419 more new vehicles in November of this year than November 2010. As was already mentioned, four domestic brands accounted for 48,776 of those extra sales. General...
- U.s. Auto Brand Market Share Chart - September 2011
The Ford Motor Company and General Motors were both able to grow their market share from August to September. Though the gains may've been slim, the increase from 16.3% to 16.6% for Ford and 19.7% to 20.4% for General Motors is still better than what...
- Popular Car Market Share In America - August 2011
America's 20 best-selling vehicles were responsible for 38.3% of all new vehicle sales in August 2011. That's down from the 39.2% of the market enjoyed by July's 20 best-selling vehicles. The 20 vehicles which make up the best sellers list...
- New Vehicle Market Share By Brand In Canada - July 2011
In comparison to June 2011, Ford's level sales and GM's decline allowed Chrysler/Dodge/Jeep/Fiat to grab a relatively enormous share of the Canadian new vehicle market. Moving up from 14.3% in June to 16.4% in July on the backs of Dodge's...
- New Vehicle Market Share By Brand In Canada - 2010 Year End
Hyundai and Kia combined to out-sell Toyota, Lexus, and Scion in Canada in 2010. Though the margin of victory was slight, just 417 sales, this is a startling development that comes in a year in which Toyota Canada sales fell 16.2%. In market share terms,...
Cars
Hyundai USA Market Share Growth 1999 - 2010
You already know Korea's autombile manufacturing industry is stronger than ever. You heard that the 2011 Hyundai Sonata was one of America's best-selling cars in 2010. You recently read about the Hyundai Genesis becoming America's 17th most-popular luxury car. A simple windshield survey will tell you the 2011 Kia Sorento is a hit - and GoodCarBadCar.net confirms it. And as a prelude to 2011, December 2010 had the all-new and very handsome 2011 Hyundai Elantra as one of America's ten top-selling cars.
Then yesterday GoodCarBadCar.net's audience scanned a couple Graphs displaying Hyundai's ability to grow their sales in the United States even when the market shrinks. And this market share pie chart from January 5th said plenty about Korea's strong standing in the U.S. marketplace, right? Well, yeah, it was pretty clear. But the chart below, yes that's the one, says more about Hyundai's growth in America than any chart GoodCarBadCar.net has ever displayed.
Starting in 1999 when Hyundai sold one out of every hundred new cars registered in America, to 2001 when Hyundai doubled its market share in just two years, to 2009 when the company's market share more than doubled, Hyundai is now parked at 4.6% of the overall U.S. automobile market. Parked? That's probably far too strong a word. Based on trends over the last twelve years, if Hyundai doesn't increase its U.S. market share, that'd be a colossal disappointment, particularly given the advent of a new Elantra, the terrific 2012 Hyundai Accent Autoguide.com covered yesterday, and the sporty 2012 Hyundai Veloster revealed in Detroit.
While we're on the subject of U.S. auto-selling market share, there are nine other significant swings from 2010, as contrasted with the company's 2009 numbers, posted below the Hyundai chart.
Chevrolet: up to 13.5% from 12.8%
Toyota: down to 12.8% from 14.3%
Honda: down to 9.5% from 10%
Nissan: up to 6.9% from 6.6%
GMC: up to 2.9% from 2.4%
Jeep: up to 2.5% from 2.2%
Scion: down to 0.4% from 0.6%
Suzuki: down to 0.2% from 0.4%
Related From GoodCarBadCar.net
Hyundai USA Sales Figures & Percentage Growth In 2010
Hyundai Santa Fe 2.4 GL Driven
U.S. Auto Sales By Brand - 2010 Year End
- U.s. Auto Brand Market Share Chart - November 2011
America's car market grew by 13.9% in November 2011. This means Americans acquired 121,419 more new vehicles in November of this year than November 2010. As was already mentioned, four domestic brands accounted for 48,776 of those extra sales. General...
- U.s. Auto Brand Market Share Chart - September 2011
The Ford Motor Company and General Motors were both able to grow their market share from August to September. Though the gains may've been slim, the increase from 16.3% to 16.6% for Ford and 19.7% to 20.4% for General Motors is still better than what...
- Popular Car Market Share In America - August 2011
America's 20 best-selling vehicles were responsible for 38.3% of all new vehicle sales in August 2011. That's down from the 39.2% of the market enjoyed by July's 20 best-selling vehicles. The 20 vehicles which make up the best sellers list...
- New Vehicle Market Share By Brand In Canada - July 2011
In comparison to June 2011, Ford's level sales and GM's decline allowed Chrysler/Dodge/Jeep/Fiat to grab a relatively enormous share of the Canadian new vehicle market. Moving up from 14.3% in June to 16.4% in July on the backs of Dodge's...
- New Vehicle Market Share By Brand In Canada - 2010 Year End
Hyundai and Kia combined to out-sell Toyota, Lexus, and Scion in Canada in 2010. Though the margin of victory was slight, just 417 sales, this is a startling development that comes in a year in which Toyota Canada sales fell 16.2%. In market share terms,...